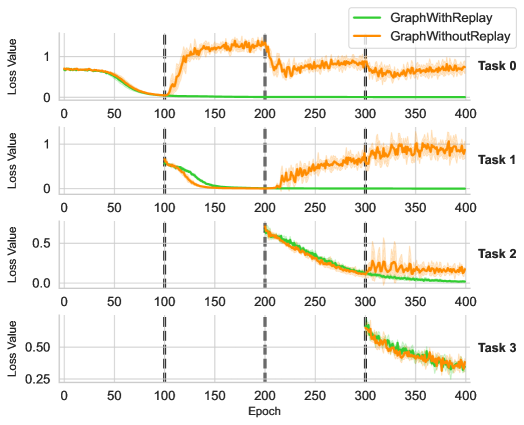
## Chart: Loss Value vs. Epoch for Different Tasks
### Overview
The image presents a series of four line graphs, each depicting the loss value over epochs for a specific task (Task 0 to Task 3). Each graph compares two scenarios: "GraphWithReplay" (green line) and "GraphWithoutReplay" (orange line). The x-axis represents the epoch number, ranging from 0 to 400. The y-axis represents the loss value, with different scales for each task. Vertical dashed lines indicate significant points in the training process, likely task transitions or interventions.
### Components/Axes
* **X-axis:** Epoch (0 to 400)
* **Y-axis:** Loss Value (scale varies for each task)
* Task 0: 0 to 1
* Task 1: 0 to 1
* Task 2: 0.0 to 0.5
* Task 3: 0.25 to 0.50
* **Legend:** Located at the top-right of the entire figure.
* Green Line: GraphWithReplay
* Orange Line: GraphWithoutReplay
* **Tasks:** Four separate graphs, labeled Task 0, Task 1, Task 2, and Task 3, stacked vertically.
* **Vertical Dashed Lines:** Located at approximately Epoch 100, 200, and 300.
### Detailed Analysis
**Task 0:**
* **GraphWithReplay (Green):** The loss value starts around 0.9, decreases to approximately 0 around epoch 100, and remains at 0 for the rest of the epochs.
* **GraphWithoutReplay (Orange):** The loss value starts around 0.9, decreases to approximately 0 around epoch 100, then increases sharply to approximately 1 around epoch 150, remains high until epoch 200, then decreases to approximately 0.9 and remains relatively stable.
**Task 1:**
* **GraphWithReplay (Green):** The loss value starts around 0.9, decreases to approximately 0 around epoch 100, and remains at 0 for the rest of the epochs.
* **GraphWithoutReplay (Orange):** The loss value starts around 0.9, decreases to approximately 0 around epoch 100, then increases sharply to approximately 1 around epoch 200, and remains high until epoch 300, then decreases to approximately 0.9 and remains relatively stable.
**Task 2:**
* **GraphWithReplay (Green):** The loss value starts around 0.5, decreases gradually to approximately 0.1 around epoch 300, and remains relatively stable.
* **GraphWithoutReplay (Orange):** The loss value starts around 0.5, decreases gradually to approximately 0.1 around epoch 300, and remains relatively stable.
**Task 3:**
* **GraphWithReplay (Green):** The loss value starts around 0.5, decreases gradually to approximately 0.3 around epoch 300, and remains relatively stable.
* **GraphWithoutReplay (Orange):** The loss value starts around 0.5, decreases gradually to approximately 0.3 around epoch 300, and remains relatively stable.
### Key Observations
* For Tasks 0 and 1, "GraphWithReplay" maintains a consistently low loss value after the initial drop, while "GraphWithoutReplay" experiences a significant increase in loss value after epoch 100 and 200, respectively.
* For Tasks 2 and 3, both "GraphWithReplay" and "GraphWithoutReplay" exhibit similar decreasing trends in loss value.
* The vertical dashed lines at epochs 100, 200, and 300 seem to mark significant changes or transitions in the training process, particularly affecting the "GraphWithoutReplay" scenario in Tasks 0 and 1.
### Interpretation
The data suggests that using replay (GraphWithReplay) is beneficial for maintaining low loss values in Tasks 0 and 1, especially after the initial training phase. The "GraphWithoutReplay" scenario experiences a significant increase in loss, indicating a potential issue with forgetting or instability in the model. For Tasks 2 and 3, the replay mechanism doesn't seem to have a significant impact, as both scenarios perform similarly. The vertical dashed lines likely represent points where new tasks are introduced or where the training regime is altered. The difference in performance between "GraphWithReplay" and "GraphWithoutReplay" in the initial tasks suggests that replay helps the model retain knowledge from previous tasks when learning new ones, mitigating catastrophic forgetting.