## Line Graph: Loss Value vs. Epoch Across Four Tasks
### Overview
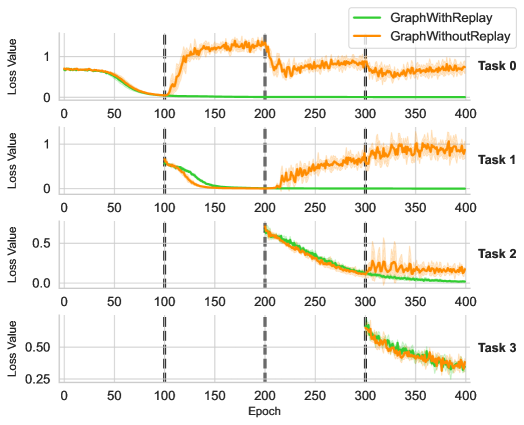
The image displays a multi-task line graph comparing the performance of two algorithms ("GraphWithReplay" and "GraphWithoutReplay") across four distinct tasks (Task 0–Task 3). Each task is represented in a separate subplot, with loss values plotted against training epochs (0–400). The graph highlights differences in convergence behavior and stability between the two approaches.
---
### Components/Axes
- **X-Axis**: Epoch (0–400, linear scale)
- **Y-Axis**: Loss Value (ranges vary per task, labeled "Loss Value")
- **Legend**: Located in the top-right corner of the entire graph.
- Green line: "GraphWithReplay"
- Orange line: "GraphWithoutReplay"
- **Subplot Structure**: Four vertically stacked panels, each labeled "Task 0" to "Task 3" in the bottom-right corner of their respective subplots.
---
### Detailed Analysis
#### Task 0
- **Green Line (GraphWithReplay)**:
- Starts at ~0.8 loss, drops sharply to ~0.1 by epoch 100, then stabilizes near 0.05.
- Minimal fluctuation after epoch 100.
- **Orange Line (GraphWithoutReplay)**:
- Begins at ~0.8, rises to ~0.9 by epoch 100, then oscillates between ~0.7–0.9 until epoch 400.
- Sharp drop to ~0.6 at epoch 200, followed by stabilization.
#### Task 1
- **Green Line**:
- Starts at ~0.6, drops to ~0.1 by epoch 100, then remains flat near 0.05.
- **Orange Line**:
- Begins at ~0.6, rises to ~0.8 by epoch 100, then fluctuates between ~0.6–0.8 until epoch 400.
- Notable spike to ~0.9 at epoch 300.
#### Task 2
- **Green Line**:
- Starts at ~0.5, decreases steadily to ~0.1 by epoch 200, then stabilizes near 0.05.
- **Orange Line**:
- Begins at ~0.5, drops to ~0.3 by epoch 200, then fluctuates between ~0.2–0.4 until epoch 400.
#### Task 3
- **Green Line**:
- Starts at ~0.5, drops to ~0.2 by epoch 300, then declines to ~0.1 by epoch 400.
- **Orange Line**:
- Begins at ~0.5, rises to ~0.6 by epoch 300, then declines to ~0.4 by epoch 400.
- Converges with the green line near epoch 400.
---
### Key Observations
1. **Consistent Performance Gap**:
- "GraphWithReplay" (green) consistently achieves lower loss values across all tasks, especially after epoch 100.
- "GraphWithoutReplay" (orange) exhibits higher loss and greater instability, with frequent fluctuations.
2. **Phase Transitions**:
- Dashed vertical lines at epochs 100 and 300 suggest potential phase changes (e.g., learning rate adjustments or task transitions).
3. **Convergence Behavior**:
- In Task 3, both algorithms converge near epoch 400, but "GraphWithReplay" maintains a ~20% advantage in loss reduction.
---
### Interpretation
The data demonstrates that incorporating replay mechanisms ("GraphWithReplay") significantly improves training stability and convergence speed across diverse tasks. The orange lines (without replay) show higher loss and erratic behavior, likely due to catastrophic forgetting or insufficient memory of prior tasks. The dashed lines at epochs 100 and 300 may correlate with task-specific milestones or hyperparameter adjustments. Notably, Task 0 and Task 1 highlight the critical role of replay in preventing performance degradation during early training phases. The convergence in Task 3 suggests that replay mechanisms become less impactful as training progresses, though "GraphWithReplay" retains a marginal edge.