## Line Chart: Learning Reward vs. Trial Number
### Overview
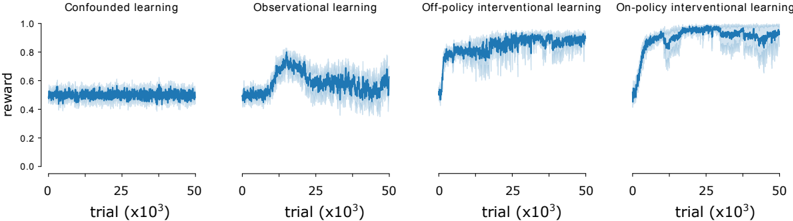
The image presents four line charts, each representing a different learning method: Confounded learning, Observational learning, Off-policy Interventional learning, and On-policy Interventional learning. Each chart plots the 'reward' on the y-axis against the 'trial' number (in thousands) on the x-axis. The charts visually compare the learning progress of each method over a series of trials.
### Components/Axes
* **X-axis Label:** "trial (x10³)" - Represents the number of trials, scaled in thousands. The scale ranges from 0 to 50 (representing 0 to 50,000 trials).
* **Y-axis Label:** "reward" - Represents the reward value. The scale ranges from 0.0 to 1.0.
* **Chart Titles:** Each chart has a title indicating the learning method: "Confounded learning", "Observational learning", "Off-policy interventional learning", "On-policy interventional learning".
* **Data Series:** Each chart contains a single blue line representing the reward over trials. The lines are accompanied by a shaded area representing the variance or standard deviation around the mean reward.
### Detailed Analysis
**1. Confounded Learning:**
* **Trend:** The line remains relatively flat throughout the trials, with minor fluctuations.
* **Data Points (approximate):**
* Trial 0: Reward ≈ 0.45
* Trial 25,000: Reward ≈ 0.48
* Trial 50,000: Reward ≈ 0.46
* The reward fluctuates between approximately 0.4 and 0.55.
**2. Observational Learning:**
* **Trend:** The line starts at a similar level as confounded learning, but exhibits a significant upward trend starting around trial 10,000, plateauing around trial 40,000.
* **Data Points (approximate):**
* Trial 0: Reward ≈ 0.45
* Trial 10,000: Reward ≈ 0.60 (start of upward trend)
* Trial 25,000: Reward ≈ 0.85
* Trial 50,000: Reward ≈ 0.90
* The reward increases from approximately 0.4 to 0.9.
**3. Off-policy Interventional Learning:**
* **Trend:** Similar to observational learning, the line shows an upward trend, but it begins earlier and reaches a higher plateau.
* **Data Points (approximate):**
* Trial 0: Reward ≈ 0.45
* Trial 5,000: Reward ≈ 0.65 (start of upward trend)
* Trial 25,000: Reward ≈ 0.95
* Trial 50,000: Reward ≈ 0.98
* The reward increases from approximately 0.4 to 0.98.
**4. On-policy Interventional Learning:**
* **Trend:** The line exhibits a rapid initial increase, followed by a plateau. The initial increase is steeper than the other methods.
* **Data Points (approximate):**
* Trial 0: Reward ≈ 0.45
* Trial 5,000: Reward ≈ 0.75 (start of upward trend)
* Trial 15,000: Reward ≈ 0.95
* Trial 50,000: Reward ≈ 0.98
* The reward increases from approximately 0.4 to 0.98.
### Key Observations
* Confounded learning shows minimal improvement over trials.
* Observational, Off-policy, and On-policy learning all demonstrate significant improvement in reward over trials.
* On-policy learning exhibits the fastest initial learning rate.
* Off-policy and On-policy learning achieve the highest final reward values.
* The shaded areas indicate variability in the reward, which appears consistent across all learning methods.
### Interpretation
The data suggests that interventional learning methods (Off-policy and On-policy) are significantly more effective than observational or confounded learning in maximizing reward. The faster learning rate of On-policy learning indicates that it may be more efficient in converging to an optimal policy. The minimal improvement in confounded learning suggests that it is unable to effectively learn from the environment due to underlying confounding factors. The variance in reward, represented by the shaded areas, indicates that the learning process is stochastic and subject to fluctuations. The charts provide a comparative analysis of different learning approaches, highlighting the benefits of interventional learning in achieving higher rewards. The differences in learning curves suggest that the methods have different exploration-exploitation trade-offs and sensitivities to the environment.