TECHNICAL ASSET FINGERPRINT
28a8bae24738e37425988896
Click to view fullscreen
Press ESC or click to close
FOUND IN PAPERS
EXPERT: gemma-3-27b-it-free VERSION 1
RUNTIME: google-free/gemma-3-27b-it
INTEL_VERIFIED
## Line Charts: Model Accuracy Degradation Under Quantization
### Overview
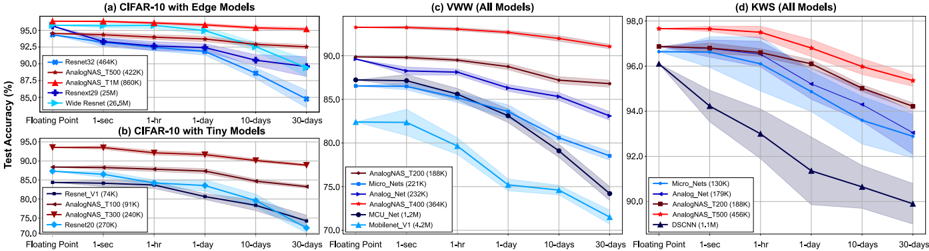
The image presents four line charts comparing the test accuracy of different neural network models under varying degrees of quantization. Quantization reduces the precision of the model's weights and activations, leading to potential accuracy loss but also reduced memory usage and faster inference. The x-axis represents the quantization level (Floating Point, 1hr, 1-day, 10-days, 30-days), and the y-axis represents the test accuracy (%). Each chart focuses on a specific dataset and model size category.
### Components/Axes
* **X-axis (all charts):** Quantization Level (Floating Point, 1hr, 1-day, 10-days, 30-days).
* **Y-axis (all charts):** Test Accuracy (%)
* **Chart (a):** CIFAR-10 with Edge Models
* **Chart (b):** CIFAR-10 with Tiny Models
* **Chart (c):** VWW (All Models)
* **Chart (d):** KWS (All Models)
* **Legend (all charts):** Lists the model names and their approximate sizes in Kilobytes (K).
### Detailed Analysis or Content Details
**Chart (a): CIFAR-10 with Edge Models**
* **ResNet32 (464K):** Starts at approximately 95.5% accuracy at Floating Point, decreases to around 92.5% at 1hr, 91.5% at 1-day, 89.5% at 10-days, and 87.5% at 30-days. (Downward trend)
* **AnalogNAS_T500 (422K):** Starts at approximately 95.0% accuracy at Floating Point, decreases to around 92.0% at 1hr, 90.5% at 1-day, 88.5% at 10-days, and 86.5% at 30-days. (Downward trend)
* **AnalogNAS_T1M (868K):** Starts at approximately 95.0% accuracy at Floating Point, decreases to around 92.0% at 1hr, 90.5% at 1-day, 88.5% at 10-days, and 86.5% at 30-days. (Downward trend)
* **ResNetD (256K):** Starts at approximately 94.5% accuracy at Floating Point, decreases to around 91.5% at 1hr, 89.5% at 1-day, 87.5% at 10-days, and 85.5% at 30-days. (Downward trend)
* **Wide ResNet (205K):** Starts at approximately 94.0% accuracy at Floating Point, decreases to around 90.5% at 1hr, 88.5% at 1-day, 86.5% at 10-days, and 84.5% at 30-days. (Downward trend)
**Chart (b): CIFAR-10 with Tiny Models**
* **ResNet_V1 (178K):** Starts at approximately 91.0% accuracy at Floating Point, decreases to around 87.0% at 1hr, 84.0% at 1-day, 81.0% at 10-days, and 78.0% at 30-days. (Downward trend)
* **AnalogNAS_T200 (90K):** Starts at approximately 90.0% accuracy at Floating Point, decreases to around 86.0% at 1hr, 83.0% at 1-day, 79.0% at 10-days, and 76.0% at 30-days. (Downward trend)
* **AnalogNAS_T300 (132K):** Starts at approximately 90.0% accuracy at Floating Point, decreases to around 86.0% at 1hr, 83.0% at 1-day, 79.0% at 10-days, and 76.0% at 30-days. (Downward trend)
* **ResNetD (276K):** Starts at approximately 89.0% accuracy at Floating Point, decreases to around 85.0% at 1hr, 82.0% at 1-day, 79.0% at 10-days, and 76.0% at 30-days. (Downward trend)
* **MobileNet_V1 (4.2M):** Starts at approximately 88.0% accuracy at Floating Point, decreases to around 84.0% at 1hr, 81.0% at 1-day, 78.0% at 10-days, and 75.0% at 30-days. (Downward trend)
**Chart (c): VWW (All Models)**
* **AnalogNAS_T200 (188K):** Starts at approximately 91.0% accuracy at Floating Point, decreases to around 88.0% at 1hr, 85.0% at 1-day, 82.0% at 10-days, and 79.0% at 30-days. (Downward trend)
* **Micro_Nets (222K):** Starts at approximately 91.0% accuracy at Floating Point, decreases to around 88.0% at 1hr, 85.0% at 1-day, 82.0% at 10-days, and 79.0% at 30-days. (Downward trend)
* **Analog_Net (320K):** Starts at approximately 90.0% accuracy at Floating Point, decreases to around 87.0% at 1hr, 84.0% at 1-day, 81.0% at 10-days, and 78.0% at 30-days. (Downward trend)
* **AnalogNAS_T400 (384K):** Starts at approximately 90.0% accuracy at Floating Point, decreases to around 87.0% at 1hr, 84.0% at 1-day, 81.0% at 10-days, and 78.0% at 30-days. (Downward trend)
* **MCU_Net (1.2M):** Starts at approximately 89.0% accuracy at Floating Point, decreases to around 86.0% at 1hr, 83.0% at 1-day, 80.0% at 10-days, and 77.0% at 30-days. (Downward trend)
**Chart (d): KWS (All Models)**
* **Micro_Nets (130K):** Starts at approximately 98.0% accuracy at Floating Point, decreases to around 96.0% at 1hr, 94.0% at 1-day, 92.0% at 10-days, and 90.0% at 30-days. (Downward trend)
* **Analog_Net (496K):** Starts at approximately 97.5% accuracy at Floating Point, decreases to around 95.5% at 1hr, 93.5% at 1-day, 91.5% at 10-days, and 89.5% at 30-days. (Downward trend)
* **AnalogNAS_T200 (188K):** Starts at approximately 97.0% accuracy at Floating Point, decreases to around 95.0% at 1hr, 93.0% at 1-day, 91.0% at 10-days, and 89.0% at 30-days. (Downward trend)
* **AnalogNAS_T500 (496K):** Starts at approximately 97.0% accuracy at Floating Point, decreases to around 95.0% at 1hr, 93.0% at 1-day, 91.0% at 10-days, and 89.0% at 30-days. (Downward trend)
* **DSCNN (1.1M):** Starts at approximately 96.5% accuracy at Floating Point, decreases to around 94.5% at 1hr, 92.5% at 1-day, 90.5% at 10-days, and 88.5% at 30-days. (Downward trend)
### Key Observations
* All models exhibit a consistent downward trend in accuracy as the quantization level increases (moving from Floating Point to 30-days).
* Larger models (higher K values) generally maintain higher accuracy at higher quantization levels compared to smaller models.
* The rate of accuracy degradation varies between models and datasets.
* The KWS dataset (Chart d) generally shows higher initial accuracy and a smaller drop in accuracy compared to the CIFAR-10 and VWW datasets.
### Interpretation
The charts demonstrate the trade-off between model accuracy and quantization. Quantization allows for reduced model size and faster inference, but at the cost of accuracy. The extent of this accuracy loss depends on the model architecture, the dataset, and the degree of quantization. The results suggest that for some models and datasets, significant quantization can be applied with minimal accuracy loss, while others are more sensitive to quantization. The larger models tend to be more robust to quantization, likely due to their greater capacity to represent the underlying data distribution. The KWS dataset's higher accuracy and smaller degradation suggest it may be easier to quantize without significant performance loss. These findings are crucial for deploying machine learning models on resource-constrained devices, where quantization is often necessary to achieve acceptable performance. The "1hr", "1-day", "10-days", and "30-days" labels likely represent different levels of post-training quantization or other forms of model compression applied over time.
DECODING INTELLIGENCE...