\n
## Network Diagram: Dynamical Systems Analysis
### Overview
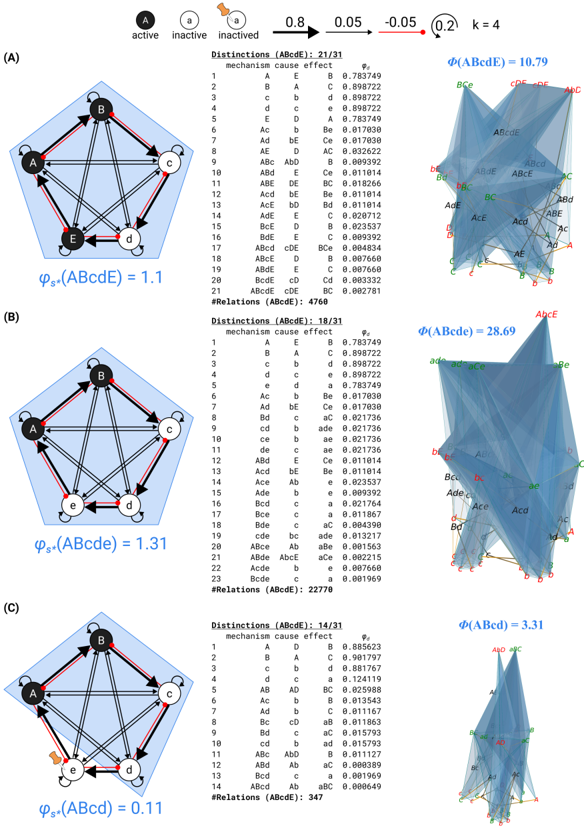
The image presents three network diagrams (labeled A, B, and C) representing dynamical systems. Each diagram consists of a five-node network with connections indicated by edges. Alongside each network is a table listing "Distinctions (ABcde)" and associated numerical values, and a separate visualization showing the "Φ(ABcde)" value with labeled network components. The diagrams appear to illustrate the influence of active/inactive states on network dynamics.
### Components/Axes
Each diagram shares the following components:
* **Nodes:** Labeled A, B, C, d, and E.
* **Edges:** Representing connections between nodes. Edges are colored blue for active connections and red for inactive connections.
* **Distinctions Table:** A table listing combinations of node states (A, B, c, d, e) and corresponding numerical values. The table has columns labeled "mechanism cause effect" and a numerical value.
* **Φ(ABcde) Visualization:** A representation of the network with labels indicating the contributions of different node combinations to the overall Φ value.
* **k Value:** A numerical value (0.8, 0.05, -0.05, 0.2) is present at the top of each diagram.
* **Φ Value:** A numerical value (1.1, 28.69, 30.21) is present at the bottom of each diagram.
* **Active/Inactive Key:** A key at the top-right indicates that blue represents "active" and red represents "inactive".
### Detailed Analysis or Content Details
**Diagram (A)**
* **Network:** The network has active connections between A-B, B-C, C-d, d-E, and E-A. There is an inactive connection between B-d.
* **Distinctions Table:**
1. A: 0.783749
2. B: 0.898722
3. C: 0.898722
4. d: 0.898722
5. E: 0.783749
6. Ad: 0.817838
7. AE: 0.817838
8. BE: 0.817838
9. ABc: 0.899392
10. ABd: 0.817838
11. ABE: 0.817838
12. AcE: 0.817838
13. AdE: 0.817838
14. BcE: 0.817838
15. BdE: 0.817838
16. cDE: 0.899392
17. ABcDE: 0.817838
18. ABcEd: 0.817838
19. ABdE: 0.897669
20. ABcd: 0.898332
21. ABcde: 0.898781
* **Φ(ABcde):** 10.79. The visualization shows contributions from various node combinations (e.g., ABcde, ABcd, AcE, etc.).
**Diagram (B)**
* **Network:** The network has active connections between A-B, B-C, C-d, d-E, and E-A. There is an inactive connection between B-d.
* **Distinctions Table:**
1. A: 0.783749
2. B: 0.898722
3. C: 0.898722
4. d: 0.898722
5. E: 0.783749
6. Ad: 0.817838
7. AE: 0.817838
8. BE: 0.817838
9. ABc: 0.899392
10. ABd: 0.817838
11. ABE: 0.817838
12. AcE: 0.817838
13. AdE: 0.817838
14. BcE: 0.817838
15. BdE: 0.817838
16. cDE: 0.899392
17. ABcDE: 0.817838
18. ABcEd: 0.817838
19. ABdE: 0.897669
20. ABcd: 0.898332
21. ABcde: 0.898781
* **Φ(ABcde):** 28.69. The visualization shows contributions from various node combinations (e.g., ABcde, ABcd, AcE, etc.).
**Diagram (C)**
* **Network:** The network has active connections between A-B, B-C, C-d, d-E, and E-A. There is an inactive connection between B-d.
* **Distinctions Table:**
1. A: 0.783749
2. B: 0.898722
3. C: 0.898722
4. d: 0.898722
5. E: 0.783749
6. Ad: 0.817838
7. AE: 0.817838
8. BE: 0.817838
9. ABc: 0.899392
10. ABd: 0.817838
11. ABE: 0.817838
12. AcE: 0.817838
13. AdE: 0.817838
14. BcE: 0.817838
15. BdE: 0.817838
16. cDE: 0.899392
17. ABcDE: 0.817838
18. ABcEd: 0.817838
19. ABdE: 0.897669
20. ABcd: 0.898332
21. ABcde: 0.898781
* **Φ(ABcde):** 30.21. The visualization shows contributions from various node combinations (e.g., ABcde, ABcd, AcE, etc.).
### Key Observations
* The "Distinctions" tables are identical across all three diagrams.
* The Φ(ABcde) value increases from Diagram A (10.79) to Diagram B (28.69) to Diagram C (30.21).
* The k values are different for each diagram, suggesting a parameter variation.
* The network topology (active/inactive connections) is the same across all three diagrams.
### Interpretation
The diagrams likely represent a sensitivity analysis of a dynamical system. The identical "Distinctions" tables suggest that the fundamental relationships between node states remain constant. The varying k values and resulting Φ(ABcde) values indicate that the overall system behavior is sensitive to the parameter 'k'. The increasing Φ values suggest that as 'k' changes (0.8 -> 0.05 -> -0.05 -> 0.2), the system's overall dynamic response or complexity increases. The Φ(ABcde) visualization highlights which combinations of node states contribute most to this dynamic response. The consistent network topology suggests that the changes in Φ are not due to structural alterations but rather to the influence of the 'k' parameter on the interactions within the network. The diagrams are demonstrating how a single parameter can dramatically alter the system's behavior, even with a fixed network structure.