## Bar Chart: CoT with 90 steps, TV 0.027
### Overview
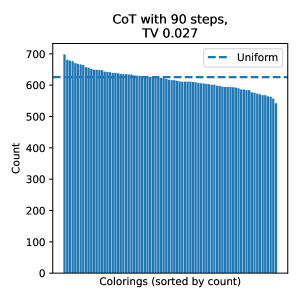
The image is a bar chart visualizing the distribution of "Colorings" (sorted by count) for a CoT (Chain of Thought) model with 90 steps and a total variation (TV) of 0.027. The chart includes a horizontal dashed line labeled "Uniform" at approximately 600 on the y-axis, serving as a reference threshold.
### Components/Axes
- **Title**: "CoT with 90 steps, TV 0.027" (top-center).
- **Y-Axis**: Labeled "Count," scaled from 0 to 700 in increments of 100.
- **X-Axis**: Labeled "Colorings (sorted by count)," with categories ordered from highest to lowest count.
- **Legend**: Located in the top-right corner, with a dashed blue line labeled "Uniform" (value ~600).
- **Bars**: Blue vertical bars representing counts for each coloring category.
### Detailed Analysis
- **Bars**:
- The tallest bar (leftmost) reaches ~700 on the y-axis.
- Bars decrease in height progressively from left to right, with the shortest bar (~500) on the far right.
- All bars are blue, matching the legend's "Uniform" line color.
- **Uniform Line**:
- A horizontal dashed blue line at y=600, intersecting the y-axis between 500 and 700.
- Approximately 80% of bars fall below this line, while the first 20% exceed it.
### Key Observations
1. **Descending Trend**: Counts decrease monotonically from left to right, indicating a concentration of high-frequency colorings in the initial categories.
2. **Uniform Threshold**: The "Uniform" line at 600 acts as a benchmark, with most colorings (80%) below this value.
3. **TV Value**: The low TV (0.027) suggests minimal deviation from uniformity, yet the chart shows a skewed distribution, implying potential contradictions or contextual nuances in the metric.
### Interpretation
The chart demonstrates that the CoT model with 90 steps produces a non-uniform distribution of colorings, despite the low TV value. The "Uniform" line likely represents an expected baseline, but the data shows a significant skew toward higher counts in the first few categories. This suggests the model may prioritize or over-represent certain colorings, raising questions about the TV metric's interpretation or the sorting criteria for the x-axis. The descending trend highlights a potential inefficiency in coverage or a bias in the model's output distribution.