## Line Chart: Training and Testing Accuracy vs. Epoch
### Overview
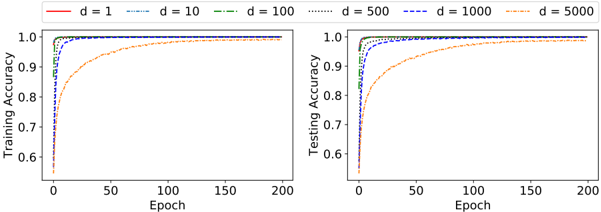
The image presents two line charts displayed side-by-side. Both charts depict accuracy (Training Accuracy on the left, Testing Accuracy on the right) as a function of Epoch, with different lines representing different values of 'd'. The charts visually compare the learning curves for various 'd' values.
### Components/Axes
* **X-axis (Both Charts):** Epoch, ranging from 0 to approximately 200.
* **Y-axis (Left Chart):** Training Accuracy, ranging from approximately 0.6 to 1.0.
* **Y-axis (Right Chart):** Testing Accuracy, ranging from approximately 0.6 to 1.0.
* **Legend (Top-Center):** Labels for each line, corresponding to different values of 'd':
* d = 1 (Red solid line)
* d = 10 (Blue dashed line)
* d = 100 (Green dotted line)
* d = 500 (Orange dash-dot line)
* d = 1000 (Black dotted line)
* d = 5000 (Purple dash-dot-dot line)
### Detailed Analysis or Content Details
**Left Chart (Training Accuracy):**
* **d = 1 (Red):** The line starts at approximately 0.65 at Epoch 0, rapidly increases to approximately 0.95 by Epoch 20, and plateaus around 0.98-1.0 for Epochs 20-200.
* **d = 10 (Blue):** Starts at approximately 0.65 at Epoch 0, increases more slowly than d=1, reaching approximately 0.9 by Epoch 50, and plateaus around 0.95-0.98 for Epochs 50-200.
* **d = 100 (Green):** Starts at approximately 0.65 at Epoch 0, increases at a moderate pace, reaching approximately 0.9 by Epoch 40, and plateaus around 0.97-0.99 for Epochs 40-200.
* **d = 500 (Orange):** Starts at approximately 0.65 at Epoch 0, increases slowly, reaching approximately 0.85 by Epoch 50, and plateaus around 0.95-0.97 for Epochs 50-200.
* **d = 1000 (Black):** Starts at approximately 0.65 at Epoch 0, increases very slowly, reaching approximately 0.8 by Epoch 50, and plateaus around 0.93-0.95 for Epochs 50-200.
* **d = 5000 (Purple):** Starts at approximately 0.65 at Epoch 0, increases extremely slowly, reaching approximately 0.75 by Epoch 50, and plateaus around 0.9-0.93 for Epochs 50-200.
**Right Chart (Testing Accuracy):**
* **d = 1 (Red):** Starts at approximately 0.65 at Epoch 0, rapidly increases to approximately 0.95 by Epoch 20, and plateaus around 0.98-1.0 for Epochs 20-200.
* **d = 10 (Blue):** Starts at approximately 0.65 at Epoch 0, increases more slowly than d=1, reaching approximately 0.9 by Epoch 50, and plateaus around 0.95-0.98 for Epochs 50-200.
* **d = 100 (Green):** Starts at approximately 0.65 at Epoch 0, increases at a moderate pace, reaching approximately 0.9 by Epoch 40, and plateaus around 0.97-0.99 for Epochs 40-200.
* **d = 500 (Orange):** Starts at approximately 0.65 at Epoch 0, increases slowly, reaching approximately 0.85 by Epoch 50, and plateaus around 0.95-0.97 for Epochs 50-200.
* **d = 1000 (Black):** Starts at approximately 0.65 at Epoch 0, increases very slowly, reaching approximately 0.8 by Epoch 50, and plateaus around 0.93-0.95 for Epochs 50-200.
* **d = 5000 (Purple):** Starts at approximately 0.65 at Epoch 0, increases extremely slowly, reaching approximately 0.75 by Epoch 50, and plateaus around 0.9-0.93 for Epochs 50-200.
### Key Observations
* The training accuracy generally increases with the number of epochs for all values of 'd'.
* The testing accuracy also generally increases with the number of epochs for all values of 'd'.
* Smaller values of 'd' (1, 10, 100) achieve higher accuracy faster than larger values of 'd' (500, 1000, 5000).
* The gap between training and testing accuracy appears to be relatively small for all values of 'd', suggesting minimal overfitting.
* The lines for d=1, d=10, and d=100 are very close to each other in both charts.
* The lines for d=500, d=1000, and d=5000 are very close to each other in both charts, and significantly lower than the other lines.
### Interpretation
The charts demonstrate the impact of the parameter 'd' on the training and testing accuracy of a model over time (epochs). The parameter 'd' likely represents a dimensionality or complexity factor within the model.
The data suggests that lower values of 'd' lead to faster learning and higher accuracy, at least within the observed range of epochs. As 'd' increases, the learning rate decreases, and the final accuracy plateaus at a lower level. This could indicate that increasing 'd' beyond a certain point introduces unnecessary complexity or noise, hindering the model's ability to generalize effectively.
The close proximity of the training and testing accuracy curves for all 'd' values suggests that the model is not significantly overfitting to the training data. The consistent trend across both charts (training and testing) reinforces the reliability of the observed relationship between 'd' and accuracy. The fact that d=500, d=1000, and d=5000 perform similarly suggests that there may be a diminishing return on increasing 'd' beyond a certain threshold. Further investigation would be needed to determine the optimal value of 'd' for maximizing performance.