## Line Chart: Success Rate vs. Number of Actions
### Overview
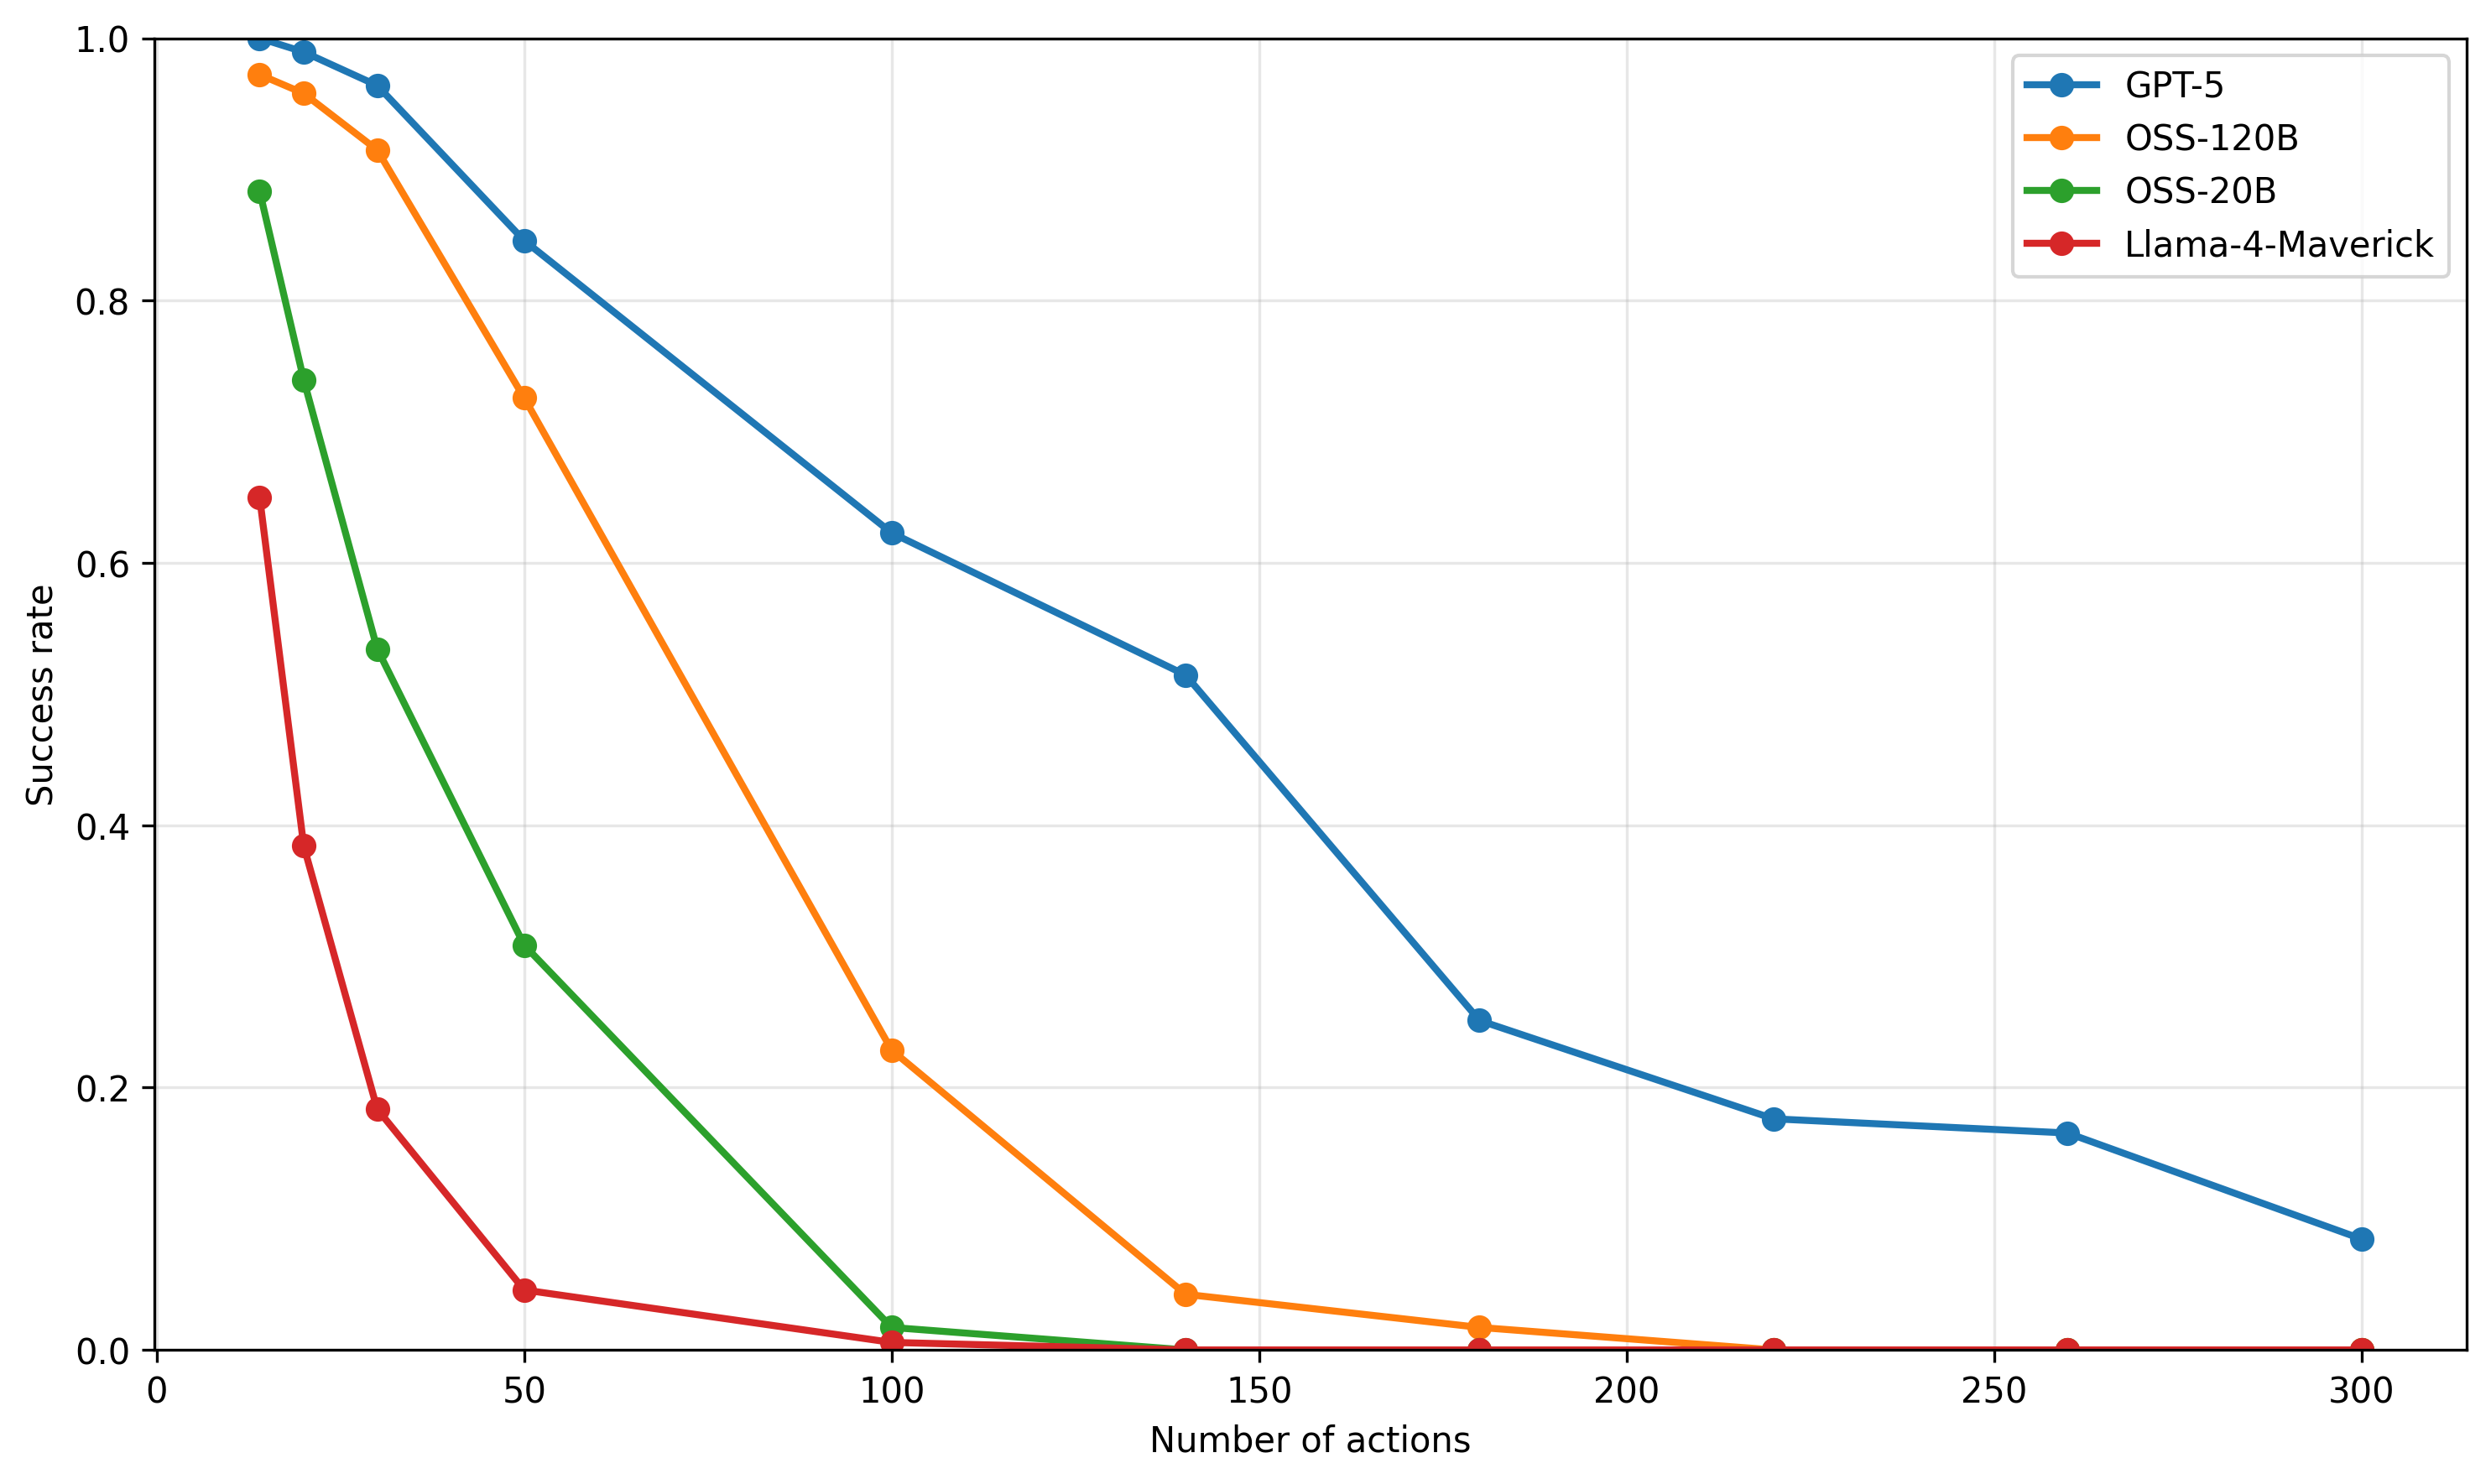
This image is a line chart illustrating the performance degradation of four distinct AI models (GPT-5, OSS-120B, OSS-20B, and Llama-4-Maverick) as the complexity or length of a task increases. The chart plots "Success rate" (y-axis) against the "Number of actions" (x-axis). All four models exhibit a negative correlation, where success rates decline as the number of actions increases, demonstrating a compounding error effect common in multi-step reasoning or agentic tasks.
### Components/Axes
* **X-Axis:** Labeled "Number of actions". The scale ranges from 0 to 300, with major grid lines at intervals of 50.
* **Y-Axis:** Labeled "Success rate". The scale ranges from 0.0 to 1.0, with major grid lines at intervals of 0.2.
* **Legend:** Located in the top-right corner. It maps the following colors to model names:
* **Blue:** GPT-5
* **Orange:** OSS-120B
* **Green:** OSS-20B
* **Red:** Llama-4-Maverick
* **Grid:** A light gray grid is overlaid to assist in reading values.
### Detailed Analysis
The data points are plotted at specific intervals along the x-axis (approximately 15, 25, 35, 50, 100, 140, 180, 220, 260, and 300).
**1. GPT-5 (Blue Line)**
* **Trend:** The most resilient model. It maintains a high success rate for the longest duration before experiencing a significant drop-off after 140 actions.
* **Data Points (Approximate):**
* x=15: ~1.0
* x=50: ~0.85
* x=100: ~0.62
* x=140: ~0.52
* x=180: ~0.25
* x=300: ~0.09
**2. OSS-120B (Orange Line)**
* **Trend:** Shows strong initial performance but experiences a sharp decline between 50 and 100 actions.
* **Data Points (Approximate):**
* x=15: ~0.98
* x=50: ~0.73
* x=100: ~0.23
* x=140: ~0.05
* x=180+: ~0.00
**3. OSS-20B (Green Line)**
* **Trend:** Significant performance drop-off occurs earlier than the larger models, specifically between 25 and 50 actions.
* **Data Points (Approximate):**
* x=15: ~0.88
* x=35: ~0.54
* x=50: ~0.31
* x=100: ~0.02
* x=140+: ~0.00
**4. Llama-4-Maverick (Red Line)**
* **Trend:** The least resilient model. It experiences a rapid "cliff" drop-off almost immediately after the first few data points.
* **Data Points (Approximate):**
* x=15: ~0.65
* x=25: ~0.38
* x=35: ~0.18
* x=50: ~0.05
* x=100+: ~0.00
### Key Observations
* **Performance Hierarchy:** There is a clear correlation between model size/capability and task length resilience. The order of performance is consistently GPT-5 > OSS-120B > OSS-20B > Llama-4-Maverick.
* **The "Cliff" Effect:** All models exhibit a non-linear decay. They maintain a relatively high success rate for a short window before hitting a "cliff" where the success rate drops precipitously toward zero.
* **Compounding Errors:** The steepness of the curves suggests that as the number of actions increases, the probability of a single error occurring—which likely invalidates the entire task—increases exponentially.
### Interpretation
This chart demonstrates the "long-horizon" capability of these AI models. In agentic workflows, where an AI must perform a sequence of actions to achieve a goal, the probability of success is the product of the probability of success for each individual step.
* **Why it matters:** The data suggests that for complex tasks requiring long sequences of actions (e.g., >100 steps), even the most capable model (GPT-5) struggles, with a success rate dropping below 60%.
* **Peircean Investigative Insight:** The visual clustering of the "cliff" points suggests that these models have a "context window" or "reasoning horizon" limit. Once the task length exceeds the model's effective planning horizon, the success rate collapses. The smaller models (Llama-4-Maverick and OSS-20B) have very short horizons, rendering them ineffective for tasks requiring more than ~50 actions, whereas GPT-5 extends this utility significantly further.