TECHNICAL ASSET FINGERPRINT
2984dad06a7127dcf8ddffb3
Click to view fullscreen
Press ESC or click to close
FOUND IN PAPERS
EXPERT: healer-alpha-free VERSION 1
RUNTIME: free/openrouter/healer-alpha
INTEL_VERIFIED
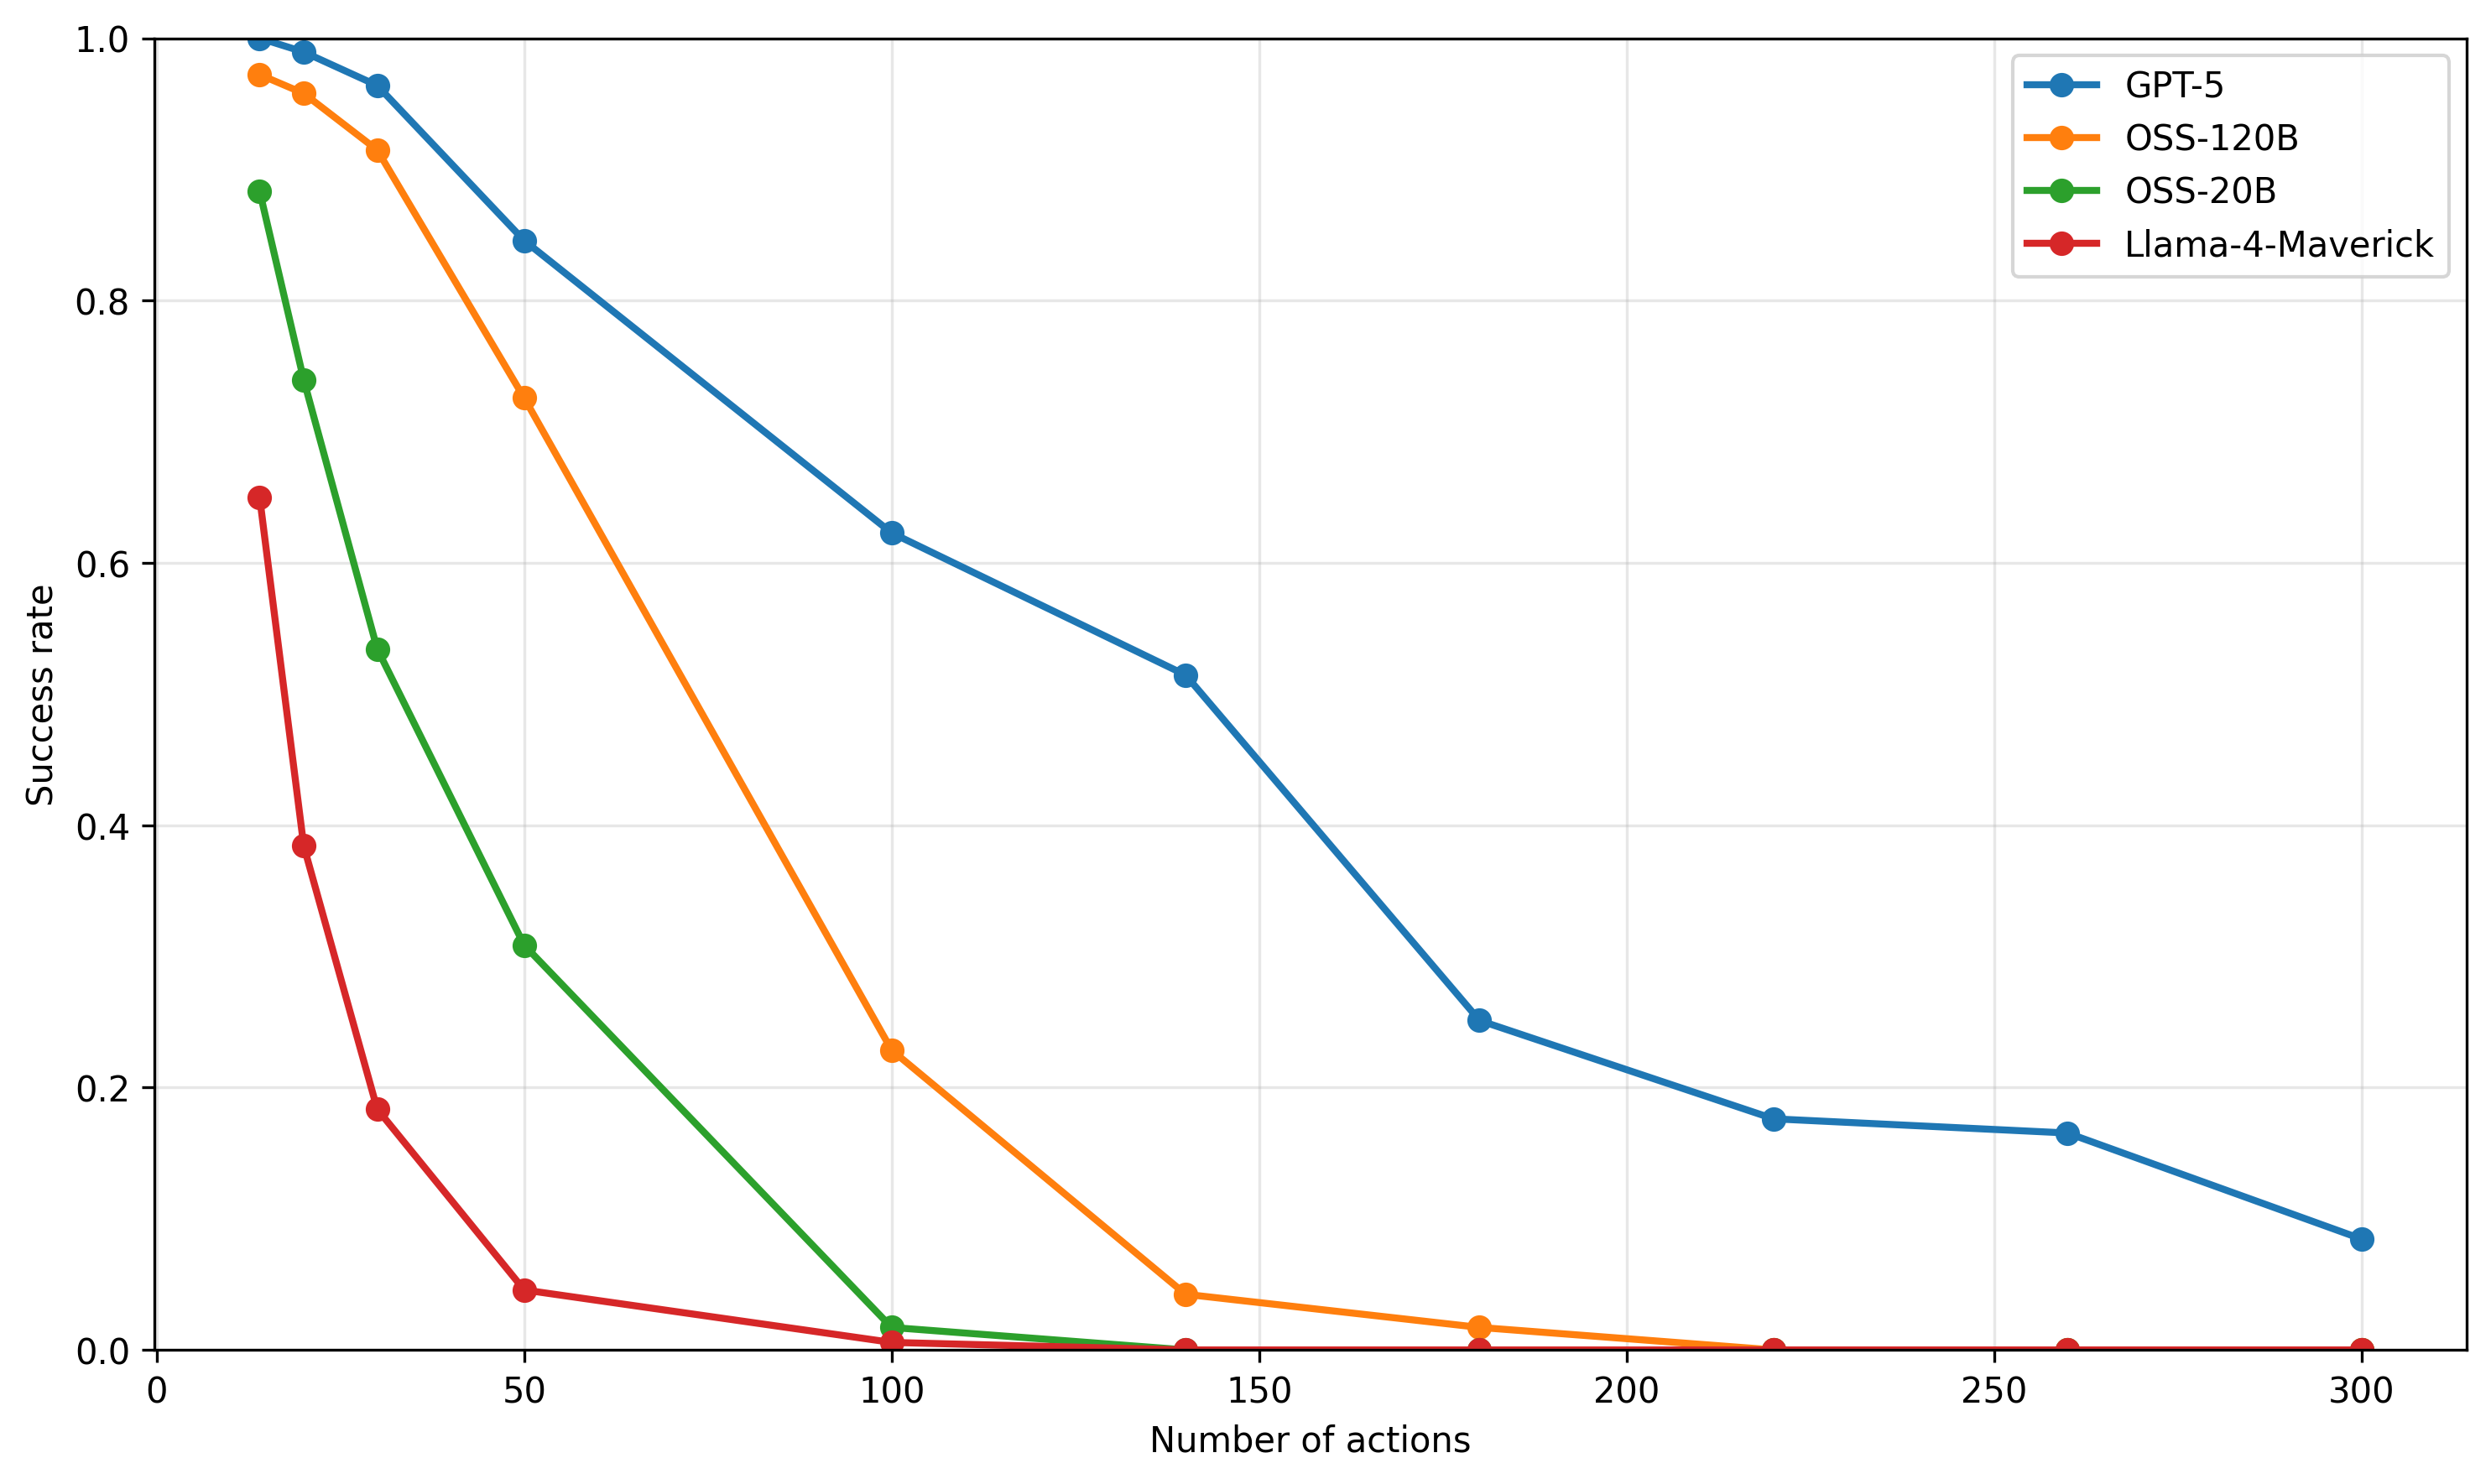
## Line Chart: Success Rate vs. Number of Actions for AI Models
### Overview
The image is a line chart comparing the performance of four different AI models. It plots the "Success rate" (y-axis) against the "Number of actions" (x-axis), showing how each model's performance degrades as the task complexity (number of actions) increases. All data series show a downward trend.
### Components/Axes
* **Chart Type:** Line chart with markers.
* **X-Axis:**
* **Label:** "Number of actions"
* **Scale:** Linear, ranging from 0 to 300.
* **Major Ticks:** 0, 50, 100, 150, 200, 250, 300.
* **Y-Axis:**
* **Label:** "Success rate"
* **Scale:** Linear, ranging from 0.0 to 1.0.
* **Major Ticks:** 0.0, 0.2, 0.4, 0.6, 0.8, 1.0.
* **Legend:** Located in the top-right corner of the chart area. It contains four entries, each with a colored line segment and a circular marker:
1. **Blue line with circle marker:** "GPT-5"
2. **Orange line with circle marker:** "OSS-120B"
3. **Green line with circle marker:** "OSS-20B"
4. **Red line with circle marker:** "Llama-4-Maverick"
* **Grid:** A light gray grid is present, aligned with the major ticks on both axes.
### Detailed Analysis
The chart displays four distinct data series, each representing a model's success rate at different action counts. The following data points are approximate, read from the chart's grid.
**1. GPT-5 (Blue Line)**
* **Trend:** The line slopes downward consistently from left to right, indicating a steady decrease in success rate as the number of actions increases. It maintains the highest success rate among all models at every data point.
* **Approximate Data Points:**
* 0 actions: ~1.00
* ~25 actions: ~0.99
* ~35 actions: ~0.96
* 50 actions: ~0.85
* 100 actions: ~0.62
* 140 actions: ~0.51
* 180 actions: ~0.25
* 220 actions: ~0.18
* 260 actions: ~0.17
* 300 actions: ~0.08
**2. OSS-120B (Orange Line)**
* **Trend:** The line slopes downward, starting very high but declining more steeply than GPT-5. It crosses below the 0.5 success rate mark between 50 and 100 actions.
* **Approximate Data Points:**
* 0 actions: ~0.97
* ~25 actions: ~0.95
* ~35 actions: ~0.91
* 50 actions: ~0.72
* 100 actions: ~0.23
* 140 actions: ~0.04
* 180 actions: ~0.02
* 220 actions: ~0.00 (appears to be at or near zero)
* 260 actions: ~0.00
* 300 actions: ~0.00
**3. OSS-20B (Green Line)**
* **Trend:** The line shows a very steep initial decline, dropping below a 0.5 success rate before 50 actions. It approaches zero success rate by 100 actions.
* **Approximate Data Points:**
* 0 actions: ~0.88
* ~20 actions: ~0.74
* ~35 actions: ~0.53
* 50 actions: ~0.31
* 100 actions: ~0.02
* 140 actions: ~0.00
* 180 actions: ~0.00
* 220 actions: ~0.00
* 260 actions: ~0.00
* 300 actions: ~0.00
**4. Llama-4-Maverick (Red Line)**
* **Trend:** The line exhibits the most severe and rapid decline. It starts at the lowest initial success rate and plummets to near-zero performance by 50 actions.
* **Approximate Data Points:**
* 0 actions: ~0.65
* ~20 actions: ~0.39
* ~35 actions: ~0.18
* 50 actions: ~0.05
* 100 actions: ~0.01
* 140 actions: ~0.00
* 180 actions: ~0.00
* 220 actions: ~0.00
* 260 actions: ~0.00
* 300 actions: ~0.00
### Key Observations
1. **Universal Negative Correlation:** All four models demonstrate a clear negative correlation between the number of actions and success rate. Performance universally degrades with increased task length/complexity.
2. **Performance Hierarchy:** A consistent performance hierarchy is maintained across the entire range: GPT-5 > OSS-120B > OSS-20B > Llama-4-Maverick.
3. **Divergence in Decay Rates:** The models differ significantly in how quickly their performance decays. GPT-5 has the most gradual slope, while Llama-4-Maverick has the steepest.
4. **Convergence to Zero:** Three of the four models (OSS-120B, OSS-20B, Llama-4-Maverick) reach a success rate at or near zero by 100-150 actions. GPT-5 is the only model that maintains a measurable, albeit low, success rate (≈0.08) at 300 actions.
5. **Initial Performance Gap:** There is a significant spread in initial success rates (at 0 actions), ranging from ~0.65 (Llama-4-Maverick) to ~1.00 (GPT-5).
### Interpretation
This chart likely illustrates the results of a benchmark evaluating AI models on sequential decision-making or multi-step reasoning tasks. The "Number of actions" represents the length or complexity of the task sequence required for completion.
* **What the data suggests:** The data strongly suggests that maintaining performance over long action sequences is a major challenge for current AI models. The ability to handle extended context or maintain coherence over many steps appears to be a key differentiator between models, with GPT-5 showing significantly greater robustness.
* **Relationship between elements:** The x-axis (complexity) is the independent variable causing the change in the y-axis (performance). The different colored lines represent different model architectures or sizes, isolating the variable of model capability. The steepness of each line is a direct visual measure of that model's "contextual robustness" or "planning horizon."
* **Notable patterns and anomalies:**
* The most striking pattern is the **exponential-like decay** for OSS-20B and Llama-4-Maverick, suggesting a critical failure point is reached relatively early in the action sequence.
* The **near-perfect initial performance** of GPT-5 and OSS-120B at 0 actions indicates they can solve the base task flawlessly, but the challenge lies entirely in scaling that success.
* The **plateauing of GPT-5's curve** between 220-260 actions (≈0.18 to ≈0.17) before a final drop is a minor anomaly that could indicate a subset of tasks solvable within that action range or a measurement artifact.
In summary, the chart provides a clear, quantitative comparison showing that while all models struggle with longer tasks, there is a substantial performance gap, with larger or more advanced models (like GPT-5) demonstrating a markedly superior ability to sustain performance as task complexity grows.
DECODING INTELLIGENCE...