## Line Chart: Success Rate vs. Number of Actions for Llama-4-Maverick-17B-128E-Instruct-FP8
### Overview
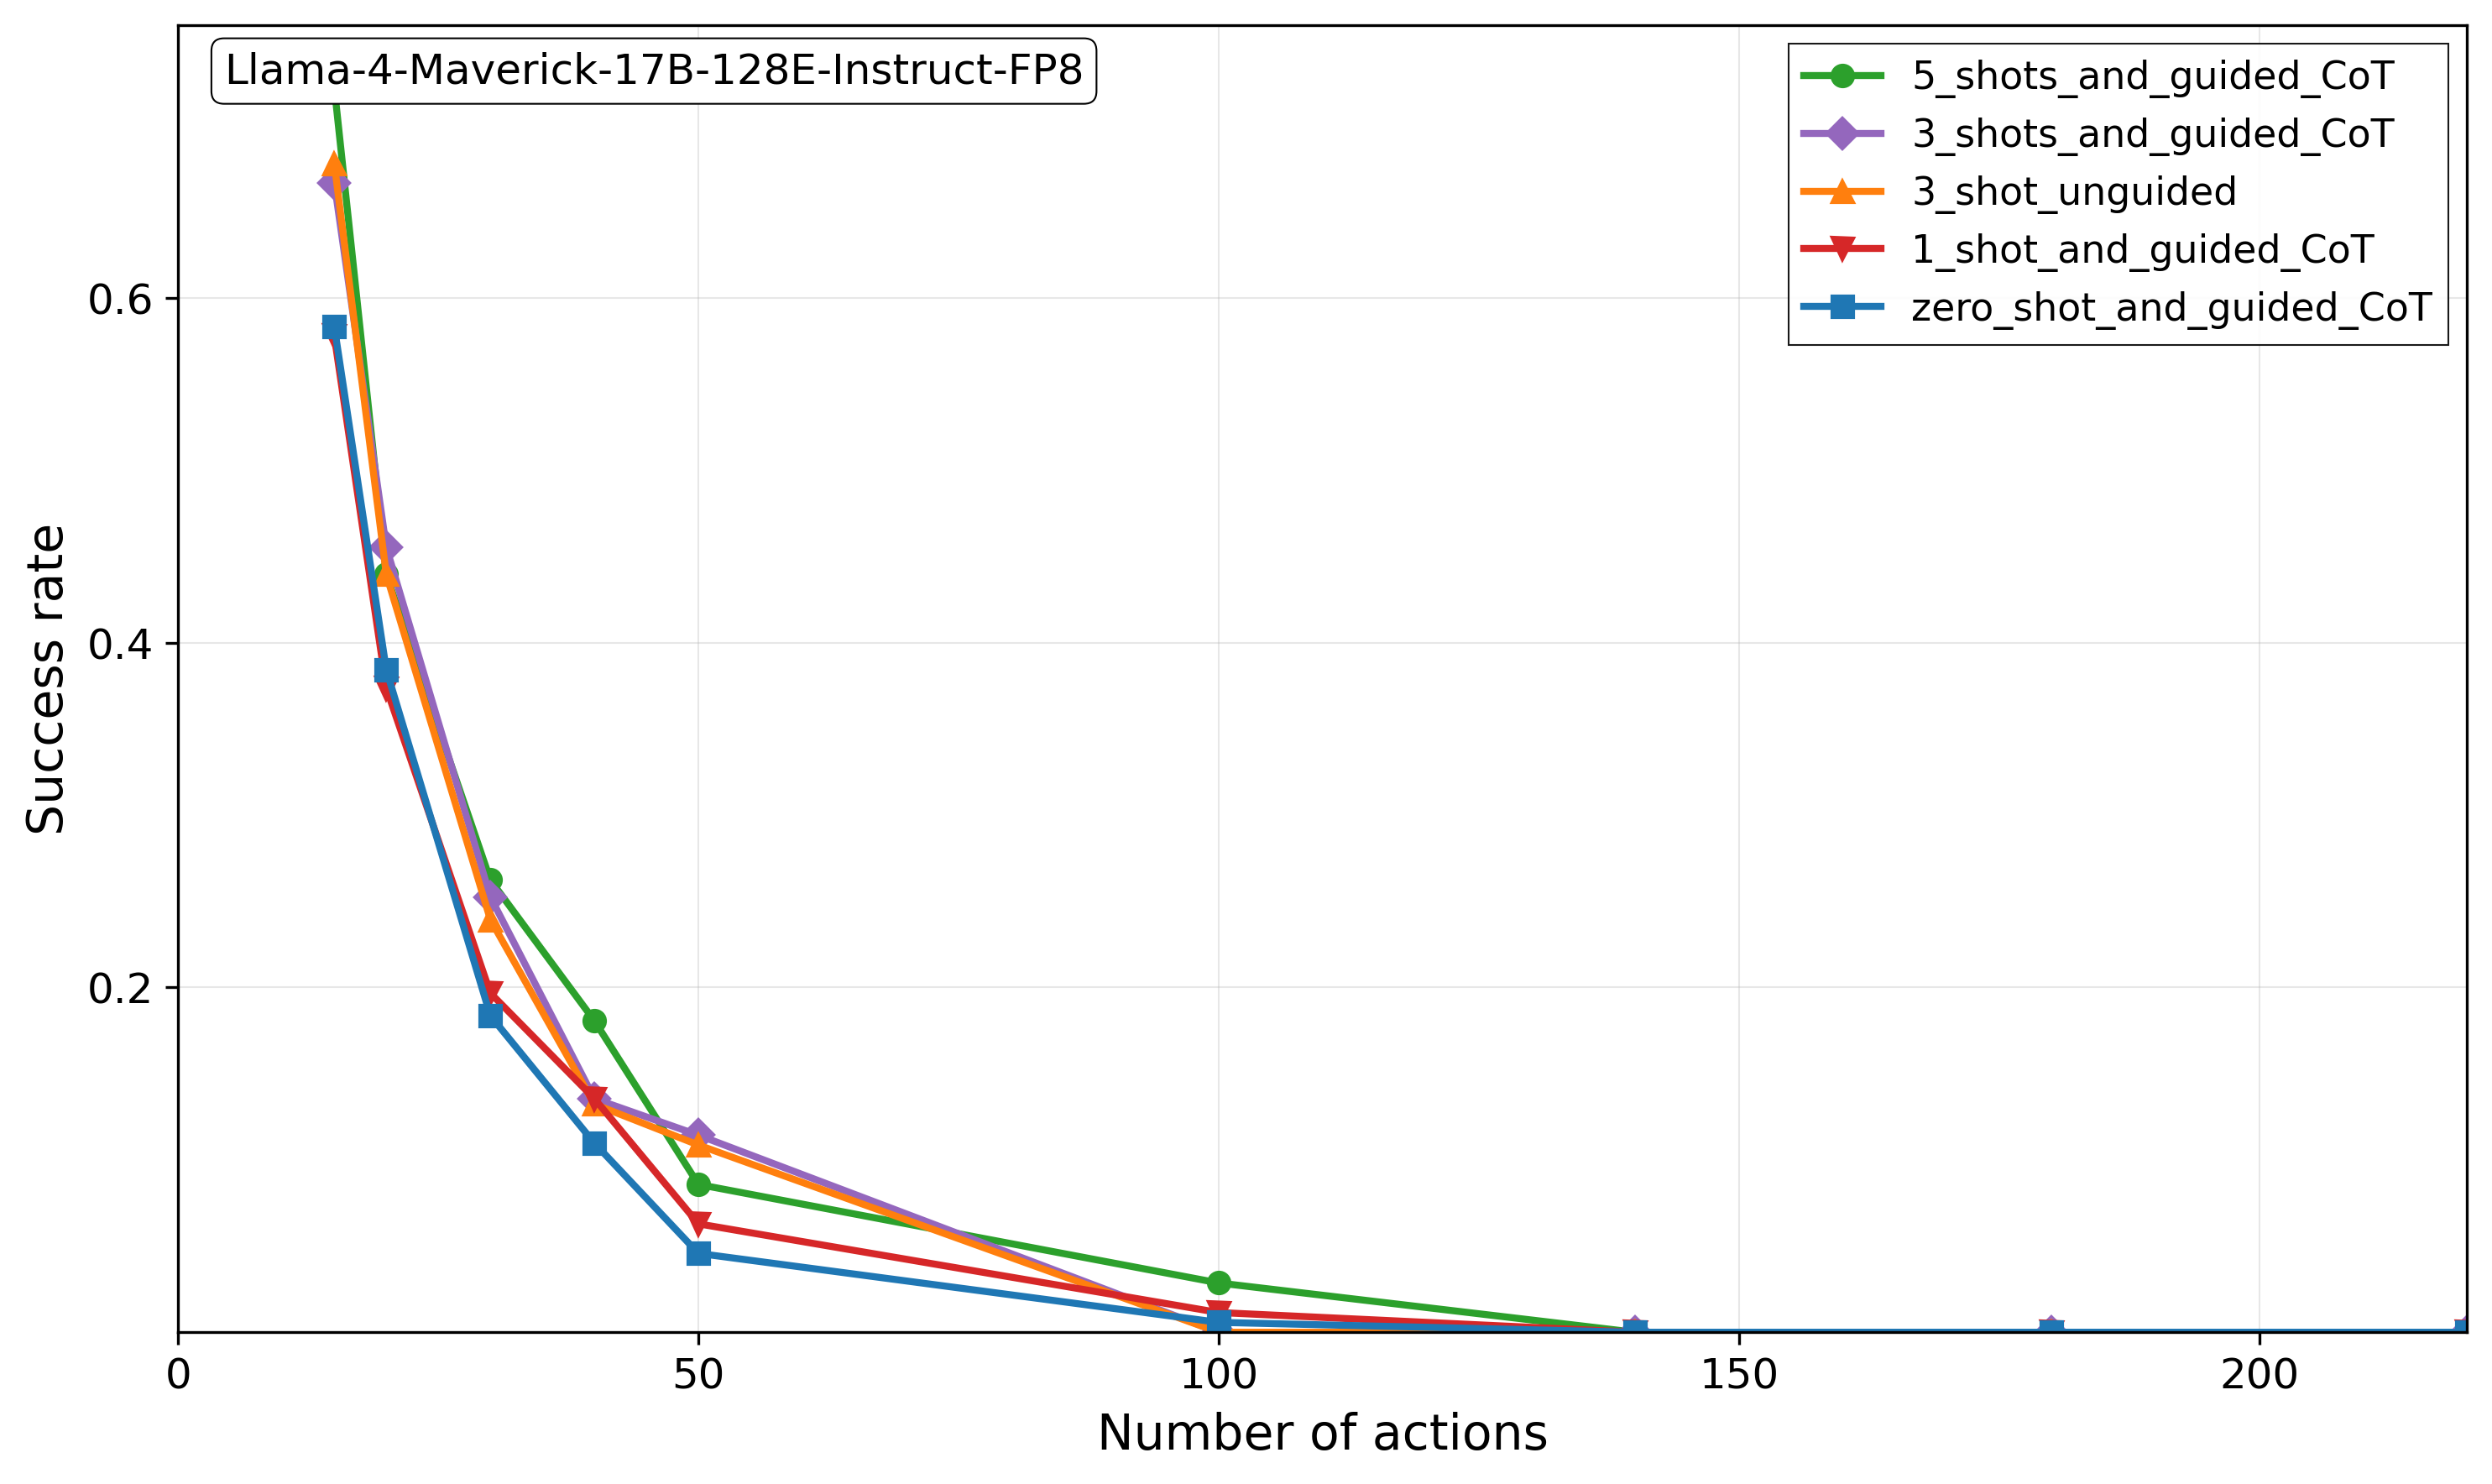
This chart illustrates the performance degradation of the "Llama-4-Maverick-17B-128E-Instruct-FP8" model as the complexity of a task—measured by the "Number of actions"—increases. The chart compares five different prompting strategies, ranging from zero-shot to 5-shot with Chain-of-Thought (CoT) guidance. All strategies exhibit a sharp, exponential-like decay in success rate as the number of actions increases.
### Components/Axes
* **Header**: "Llama-4-Maverick-17B-128E-Instruct-FP8" (Top-left).
* **X-Axis**: "Number of actions". Linear scale, marked at 0, 50, 100, 150, 200.
* **Y-Axis**: "Success rate". Linear scale, marked at 0, 0.2, 0.4, 0.6.
* **Legend**: Located in the top-right corner.
* **Green circle**: `5_shots_and_guided_CoT`
* **Purple diamond**: `3_shots_and_guided_CoT`
* **Orange triangle (up)**: `3_shot_unguided`
* **Red triangle (down)**: `1_shot_and_guided_CoT`
* **Blue square**: `zero_shot_and_guided_CoT`
### Detailed Analysis
The chart displays five data series, all showing a steep downward trend. The data points are clustered at specific intervals along the X-axis (approximately 15, 20, 30, 40, 50, 100, 140, 180, 220).
**Trend Verification:**
All five series start at a high success rate (approx. 0.65–0.70) at the lowest action count (~15) and drop precipitously to near-zero success rates as the number of actions exceeds 100.
**Data Point Estimates (Approximate):**
| Number of Actions | 5-shots (Green) | 3-shots CoT (Purple) | 3-shot Unguided (Orange) | 1-shot CoT (Red) | Zero-shot CoT (Blue) |
| :--- | :--- | :--- | :--- | :--- | :--- |
| **~15** | ~0.70 | ~0.68 | ~0.69 | ~0.67 | ~0.58 |
| **~20** | ~0.45 | ~0.46 | ~0.44 | ~0.38 | ~0.38 |
| **~30** | ~0.27 | ~0.25 | ~0.24 | ~0.20 | ~0.18 |
| **~40** | ~0.18 | ~0.14 | ~0.14 | ~0.14 | ~0.11 |
| **~50** | ~0.09 | ~0.12 | ~0.11 | ~0.07 | ~0.05 |
| **~100** | ~0.04 | ~0.02 | ~0.02 | ~0.01 | ~0.01 |
*Note: Beyond 100 actions, all series converge toward a success rate of 0.*
### Key Observations
* **Performance Convergence**: While there is a noticeable spread in success rates at lower action counts (15–50), the performance gap between the different prompting strategies narrows significantly as the number of actions increases. By 100 actions, all strategies perform poorly (success rate < 0.05).
* **Initial Performance**: At the lowest action count (~15), the `5_shots_and_guided_CoT` (Green) and `3_shot_unguided` (Orange) strategies appear to have the highest success rates.
* **Mid-Range Divergence**: At 50 actions, the `3_shots_and_guided_CoT` (Purple) and `3_shot_unguided` (Orange) strategies maintain a slightly higher success rate compared to the `5_shots_and_guided_CoT` (Green), which drops more sharply between 40 and 50 actions.
* **Zero-Shot Baseline**: The `zero_shot_and_guided_CoT` (Blue) consistently performs at or near the bottom of the group across all action counts, indicating that providing examples (shots) generally improves performance for this model.
### Interpretation
The data demonstrates that the Llama-4-Maverick-17B-128E-Instruct-FP8 model suffers from a severe "context length" or "task complexity" penalty. Regardless of the prompting strategy used (CoT, few-shot, or unguided), the model's ability to successfully complete tasks drops off exponentially as the number of required actions increases.
The prompting strategies provide a "cushion" at low action counts, but they fail to mitigate the fundamental degradation of the model's reasoning capabilities as the task length grows. The fact that all lines converge to near-zero success rates suggests that the model's failure is likely due to an inherent limitation in handling long-horizon planning or extended action sequences, rather than a limitation of the prompting technique itself.