\n
## Line Chart: Success Rate vs. Number of Actions for Llama-4-Maverick-17B-128E-Instruct-FP8
### Overview
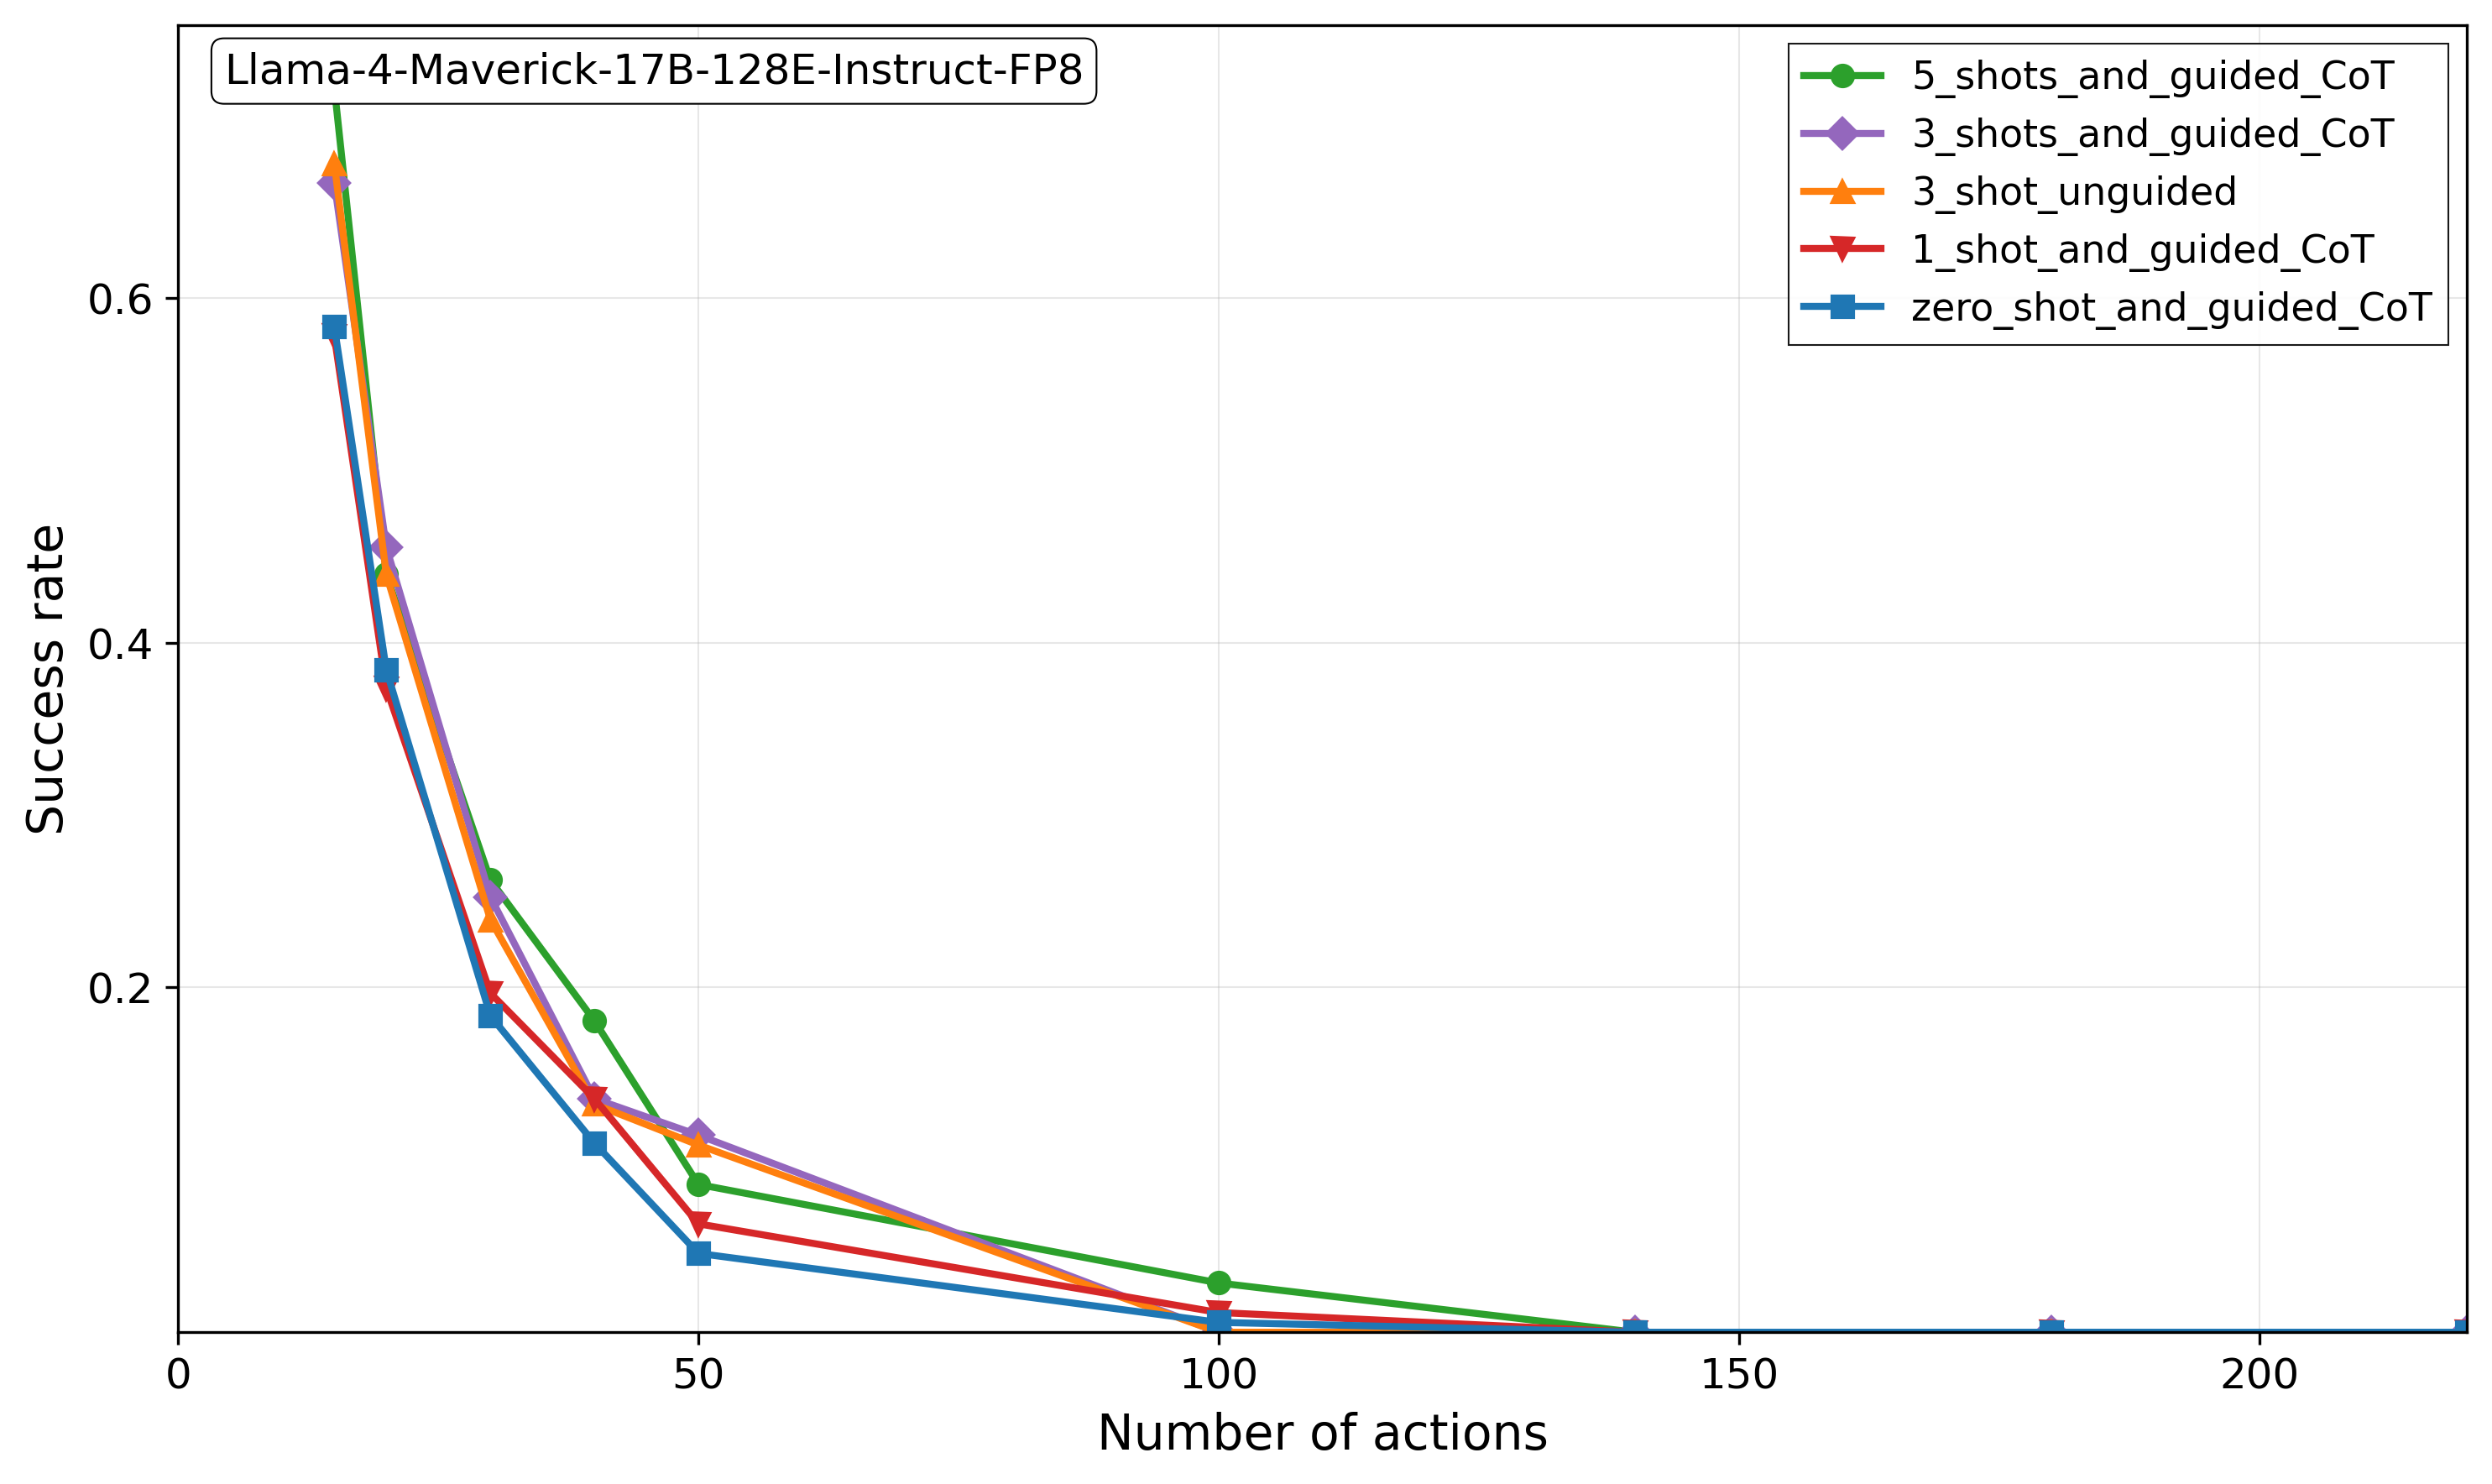
This line chart illustrates the performance degradation of the "Llama-4-Maverick-17B-128E-Instruct-FP8" model as task complexity increases. It plots the "Success rate" against the "Number of actions" required, comparing five different prompting strategies. The overall trend shows a sharp, non-linear decline in success rate for all methods as the number of actions grows.
### Components/Axes
* **Chart Title (Top-Left):** "Llama-4-Maverick-17B-128E-Instruct-FP8"
* **X-Axis (Bottom):** Label: "Number of actions". Scale: Linear, with major tick marks at 0, 50, 100, 150, and 200.
* **Y-Axis (Left):** Label: "Success rate". Scale: Linear, with major tick marks at 0.0, 0.2, 0.4, and 0.6.
* **Legend (Top-Right):** Contains five entries, each with a unique color and marker symbol:
1. Green line with circle markers: `5_shots_and_guided_CoT`
2. Purple line with diamond markers: `3_shots_and_guided_CoT`
3. Orange line with upward-pointing triangle markers: `3_shot_unguided`
4. Red line with downward-pointing triangle markers: `1_shot_and_guided_CoT`
5. Blue line with square markers: `zero_shot_and_guided_CoT`
### Detailed Analysis
All five data series exhibit a similar trend: a steep, convex decline in success rate from a low number of actions (approximately 10-20) to around 50 actions, followed by a much shallower decline that asymptotically approaches zero.
**Trend Verification & Data Point Extraction (Approximate Values):**
1. **5_shots_and_guided_CoT (Green, Circles):**
* **Trend:** Consistently the highest-performing method across all action counts. Starts highest, declines steeply, but maintains a lead.
* **Points:** At ~10 actions: ~0.68. At ~20 actions: ~0.45. At ~30 actions: ~0.26. At ~40 actions: ~0.18. At 50 actions: ~0.09. At 100 actions: ~0.04. At 150+ actions: ~0.00.
2. **3_shots_and_guided_CoT (Purple, Diamonds):**
* **Trend:** Second-highest performance initially, closely follows the green line but slightly below it.
* **Points:** At ~10 actions: ~0.67. At ~20 actions: ~0.46. At ~30 actions: ~0.25. At ~40 actions: ~0.14. At 50 actions: ~0.12. At 100 actions: ~0.01. At 150+ actions: ~0.00.
3. **3_shot_unguided (Orange, Up-Triangles):**
* **Trend:** Starts very high (near the top), but its decline is slightly steeper than the guided 3-shot method after ~20 actions.
* **Points:** At ~10 actions: ~0.69. At ~20 actions: ~0.44. At ~30 actions: ~0.24. At ~40 actions: ~0.13. At 50 actions: ~0.11. At 100 actions: ~0.00. At 150+ actions: ~0.00.
4. **1_shot_and_guided_CoT (Red, Down-Triangles):**
* **Trend:** Performance is consistently below the 3-shot and 5-shot methods. Its decline is parallel to the others.
* **Points:** At ~10 actions: ~0.59. At ~20 actions: ~0.38. At ~30 actions: ~0.20. At ~40 actions: ~0.14. At 50 actions: ~0.06. At 100 actions: ~0.01. At 150+ actions: ~0.00.
5. **zero_shot_and_guided_CoT (Blue, Squares):**
* **Trend:** The lowest-performing method at every measured point. Shows the most severe initial drop.
* **Points:** At ~10 actions: ~0.58. At ~20 actions: ~0.38. At ~30 actions: ~0.18. At ~40 actions: ~0.11. At 50 actions: ~0.05. At 100 actions: ~0.00. At 150+ actions: ~0.00.
### Key Observations
1. **Universal Degradation:** Success rate for all prompting strategies collapses as the number of actions increases beyond a very small number (~10-20).
2. **Performance Hierarchy:** A clear and consistent hierarchy exists: `5_shots_and_guided_CoT` > `3_shots_and_guided_CoT` ≈ `3_shot_unguided` > `1_shot_and_guided_CoT` > `zero_shot_and_guided_CoT`. More examples ("shots") generally correlate with better performance.
3. **Guidance vs. Unguided:** For the 3-shot case, the guided CoT (`3_shots_and_guided_CoT`) and unguided (`3_shot_unguided`) methods perform very similarly, with the guided version showing a slight advantage at higher action counts (e.g., at 50 actions).
4. **Convergence to Zero:** By 100 actions, all methods have a success rate at or very near zero. The lines converge and flatten along the x-axis from 100 to 200 actions.
5. **Steep Initial Drop:** The most significant performance loss occurs between approximately 10 and 50 actions, where success rates drop by 80-90% of their initial value.
### Interpretation
This chart demonstrates a fundamental limitation in the model's ability to maintain coherent, successful performance over extended sequential reasoning or multi-step tasks. The "Number of actions" likely represents steps in a plan, tool-use sequences, or reasoning chains.
* **What the data suggests:** The model's reliability is highly sensitive to task length. Even with advanced prompting techniques like few-shot examples and guided Chain-of-Thought (CoT), its capacity to execute long action sequences successfully diminishes rapidly. The benefit of adding more examples (shots) is clear but does not prevent the eventual collapse.
* **Relationship between elements:** The legend defines the independent variable (prompting strategy), while the axes show the relationship between task length (actions) and outcome (success). The tight clustering of lines indicates that while prompting strategy matters, the underlying model's constraint with long horizons is the dominant factor.
* **Notable anomalies/outliers:** There are no major outliers; the data follows a very smooth, predictable decay curve for all series. The most notable finding is the **lack of a plateau**—performance does not stabilize at a low level but continues to degrade towards zero, indicating a complete failure mode for long action sequences.
* **Peircean Investigation:** The chart is an **index** of the model's cognitive "working memory" or planning horizon. It points to a physical or architectural limit in the model's context or attention mechanism when processing long, dependent chains of actions. The **symbol** of "success rate" here represents functional competence, which is shown to be a fragile resource that degrades with use (actions). The **icon** of the steeply falling lines visually argues that current LLMs, even powerful ones, are not yet reliable agents for complex, long-horizon tasks without significant external scaffolding or error correction.