TECHNICAL ASSET FINGERPRINT
29926b62ee854d14b9b96a52
Click to view fullscreen
Press ESC or click to close
FOUND IN PAPERS
EXPERT: gemini-2.0-flash VERSION 1
RUNTIME: nugit/gemini/gemini-2.0-flash
INTEL_VERIFIED
## Heatmap: Coverage of Different Generation and Refinement Methods
### Overview
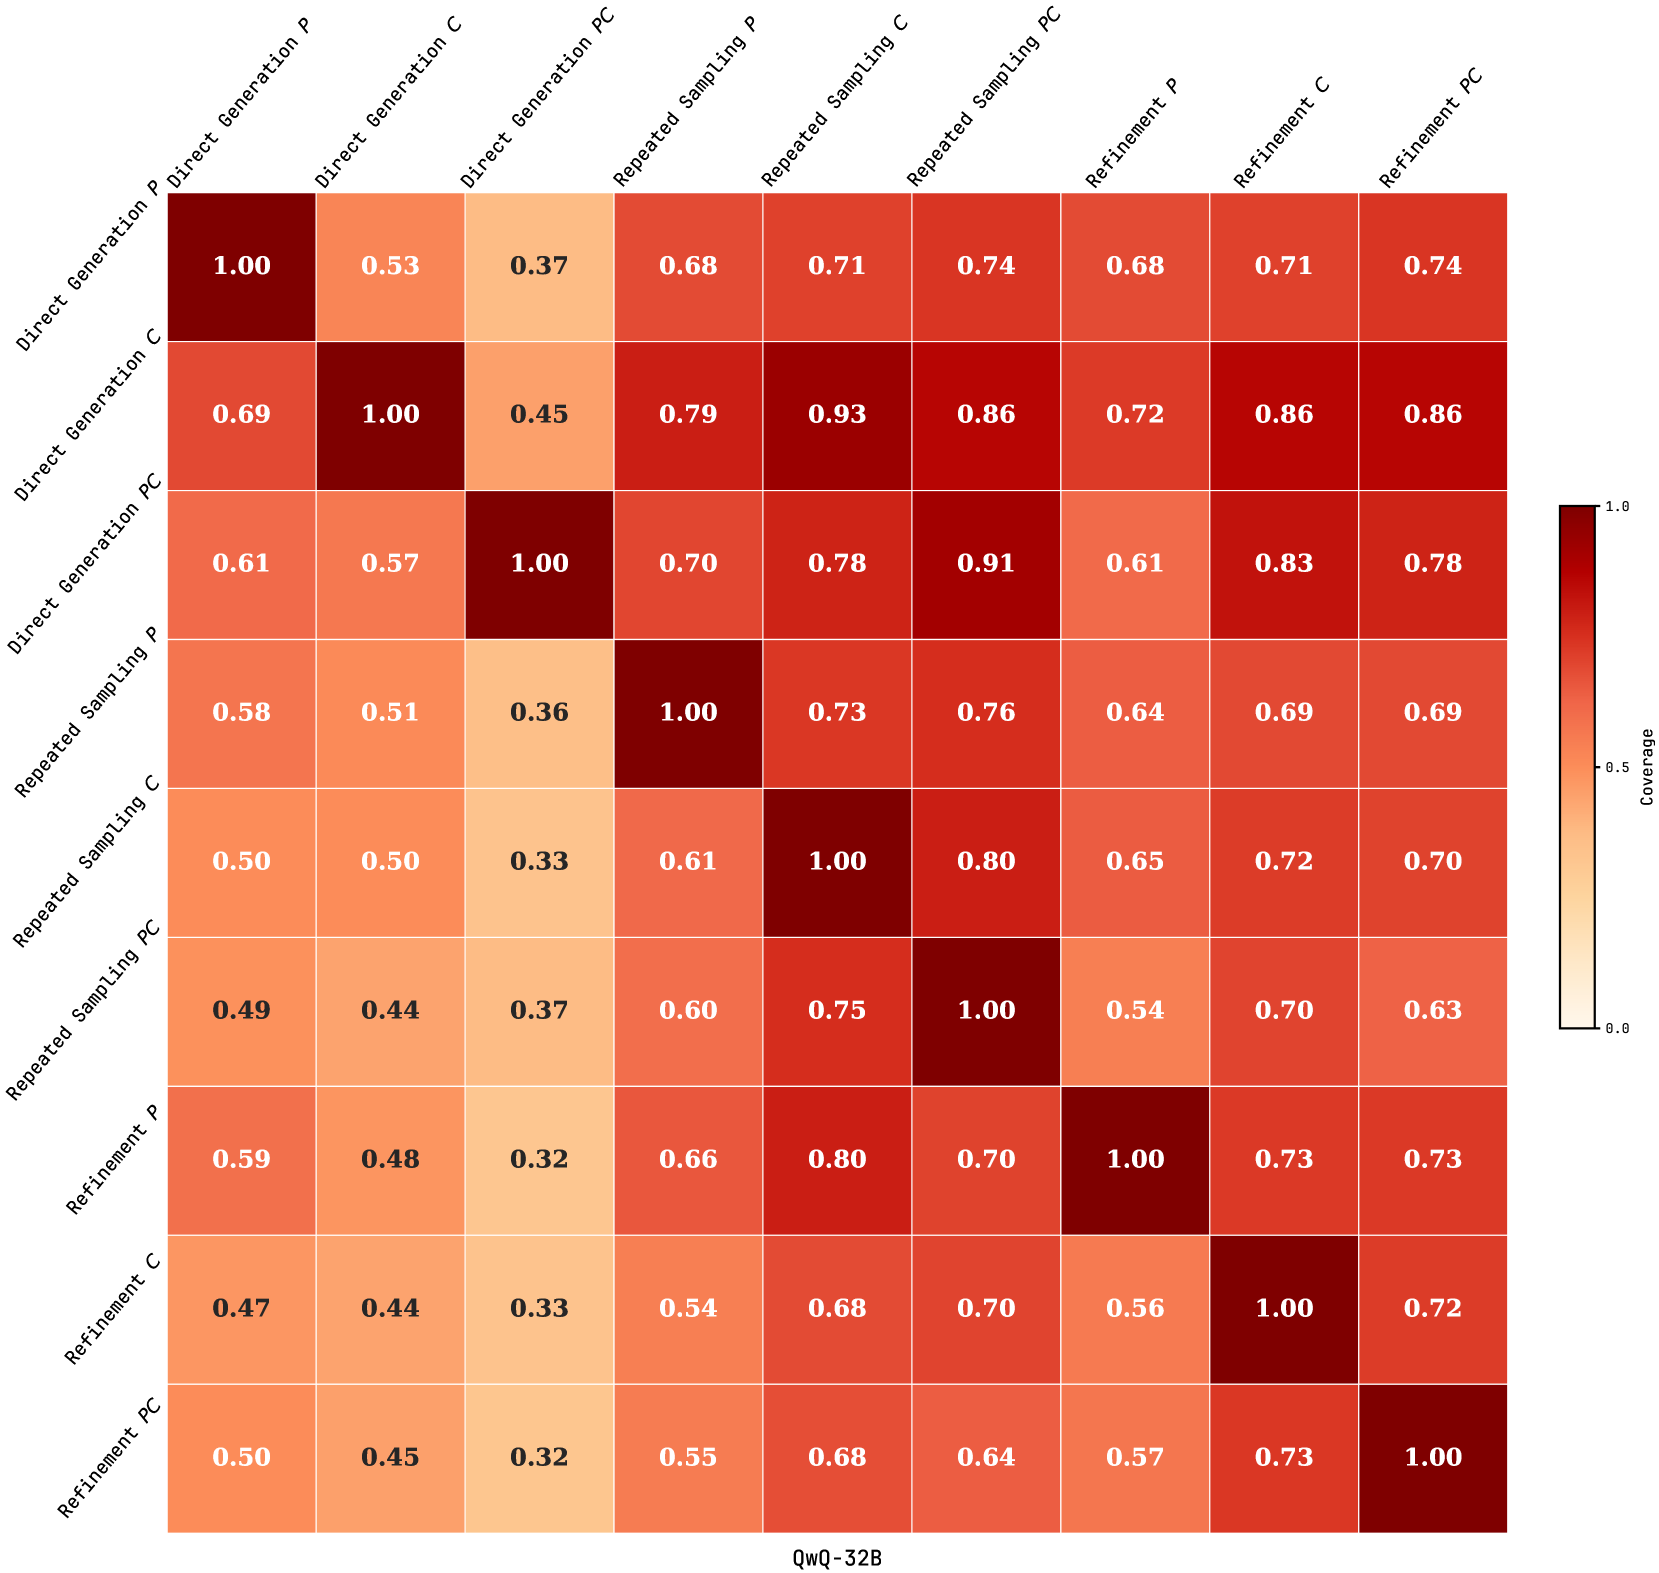
The image is a heatmap displaying the coverage between different combinations of generation and refinement methods. The methods include "Direct Generation," "Repeated Sampling," and "Refinement," each with variations "P," "C," and "PC." The heatmap uses a color gradient to represent coverage values, ranging from light (low coverage) to dark (high coverage). The matrix is symmetrical along the diagonal, where each method compared to itself has a coverage of 1.00.
### Components/Axes
* **Rows and Columns:** The rows and columns represent the different generation and refinement methods:
* Direct Generation P
* Direct Generation C
* Direct Generation PC
* Repeated Sampling P
* Repeated Sampling C
* Repeated Sampling PC
* Refinement P
* Refinement C
* Refinement PC
* **Color Scale (Legend):** Located on the right side of the heatmap.
* Dark Red: Represents a coverage of 1.0
* Light Yellow: Represents a coverage of 0.0
* Intermediate colors represent coverage values between 0.0 and 1.0.
* **Title:** "QwQ-32B" at the bottom center of the heatmap.
### Detailed Analysis
The heatmap displays the coverage between different combinations of generation and refinement methods. The values range from 0.32 to 1.00.
* **Direct Generation P:**
* Coverage with Direct Generation P: 1.00
* Coverage with Direct Generation C: 0.53
* Coverage with Direct Generation PC: 0.37
* Coverage with Repeated Sampling P: 0.68
* Coverage with Repeated Sampling C: 0.71
* Coverage with Repeated Sampling PC: 0.74
* Coverage with Refinement P: 0.68
* Coverage with Refinement C: 0.71
* Coverage with Refinement PC: 0.74
* **Direct Generation C:**
* Coverage with Direct Generation P: 0.69
* Coverage with Direct Generation C: 1.00
* Coverage with Direct Generation PC: 0.45
* Coverage with Repeated Sampling P: 0.79
* Coverage with Repeated Sampling C: 0.93
* Coverage with Repeated Sampling PC: 0.86
* Coverage with Refinement P: 0.72
* Coverage with Refinement C: 0.86
* Coverage with Refinement PC: 0.86
* **Direct Generation PC:**
* Coverage with Direct Generation P: 0.61
* Coverage with Direct Generation C: 0.57
* Coverage with Direct Generation PC: 1.00
* Coverage with Repeated Sampling P: 0.70
* Coverage with Repeated Sampling C: 0.78
* Coverage with Repeated Sampling PC: 0.91
* Coverage with Refinement P: 0.61
* Coverage with Refinement C: 0.83
* Coverage with Refinement PC: 0.78
* **Repeated Sampling P:**
* Coverage with Direct Generation P: 0.58
* Coverage with Direct Generation C: 0.51
* Coverage with Direct Generation PC: 0.36
* Coverage with Repeated Sampling P: 1.00
* Coverage with Repeated Sampling C: 0.73
* Coverage with Repeated Sampling PC: 0.76
* Coverage with Refinement P: 0.64
* Coverage with Refinement C: 0.69
* Coverage with Refinement PC: 0.69
* **Repeated Sampling C:**
* Coverage with Direct Generation P: 0.50
* Coverage with Direct Generation C: 0.50
* Coverage with Direct Generation PC: 0.33
* Coverage with Repeated Sampling P: 0.61
* Coverage with Repeated Sampling C: 1.00
* Coverage with Repeated Sampling PC: 0.80
* Coverage with Refinement P: 0.65
* Coverage with Refinement C: 0.72
* Coverage with Refinement PC: 0.70
* **Repeated Sampling PC:**
* Coverage with Direct Generation P: 0.49
* Coverage with Direct Generation C: 0.44
* Coverage with Direct Generation PC: 0.37
* Coverage with Repeated Sampling P: 0.60
* Coverage with Repeated Sampling C: 0.75
* Coverage with Repeated Sampling PC: 1.00
* Coverage with Refinement P: 0.54
* Coverage with Refinement C: 0.70
* Coverage with Refinement PC: 0.63
* **Refinement P:**
* Coverage with Direct Generation P: 0.59
* Coverage with Direct Generation C: 0.48
* Coverage with Direct Generation PC: 0.32
* Coverage with Repeated Sampling P: 0.66
* Coverage with Repeated Sampling C: 0.80
* Coverage with Repeated Sampling PC: 0.70
* Coverage with Refinement P: 1.00
* Coverage with Refinement C: 0.73
* Coverage with Refinement PC: 0.73
* **Refinement C:**
* Coverage with Direct Generation P: 0.47
* Coverage with Direct Generation C: 0.44
* Coverage with Direct Generation PC: 0.33
* Coverage with Repeated Sampling P: 0.54
* Coverage with Repeated Sampling C: 0.68
* Coverage with Repeated Sampling PC: 0.70
* Coverage with Refinement P: 0.56
* Coverage with Refinement C: 1.00
* Coverage with Refinement PC: 0.72
* **Refinement PC:**
* Coverage with Direct Generation P: 0.50
* Coverage with Direct Generation C: 0.45
* Coverage with Direct Generation PC: 0.32
* Coverage with Repeated Sampling P: 0.55
* Coverage with Repeated Sampling C: 0.68
* Coverage with Repeated Sampling PC: 0.64
* Coverage with Refinement P: 0.57
* Coverage with Refinement C: 0.73
* Coverage with Refinement PC: 1.00
### Key Observations
* The diagonal elements are all 1.00, indicating perfect coverage when a method is compared to itself.
* Direct Generation C has the highest coverage with Repeated Sampling C (0.93) and Refinement C (0.86).
* Direct Generation PC has the highest coverage with Repeated Sampling PC (0.91) and Refinement C (0.83).
* Refinement C and Refinement PC show relatively high coverage with each other (0.73 and 0.72, respectively).
* The lowest coverage values are generally observed between Direct Generation PC and other methods.
### Interpretation
The heatmap provides a comparative analysis of the coverage achieved by different generation and refinement methods. The high coverage values along the diagonal are expected, as they represent the self-comparison of each method. The off-diagonal values indicate the degree of overlap or similarity between the outputs of different methods.
The higher coverage between Direct Generation C and Repeated Sampling/Refinement C suggests that these methods produce more similar results. Conversely, the lower coverage between Direct Generation PC and other methods may indicate that this method generates more diverse or distinct outputs.
The data suggests that the choice of generation and refinement methods can significantly impact the coverage and similarity of the generated content. Researchers and practitioners can use this information to select the most appropriate combination of methods for their specific needs and objectives.
DECODING INTELLIGENCE...