## Line Graph: Run family (loops) Accuracy vs Training Steps
### Overview
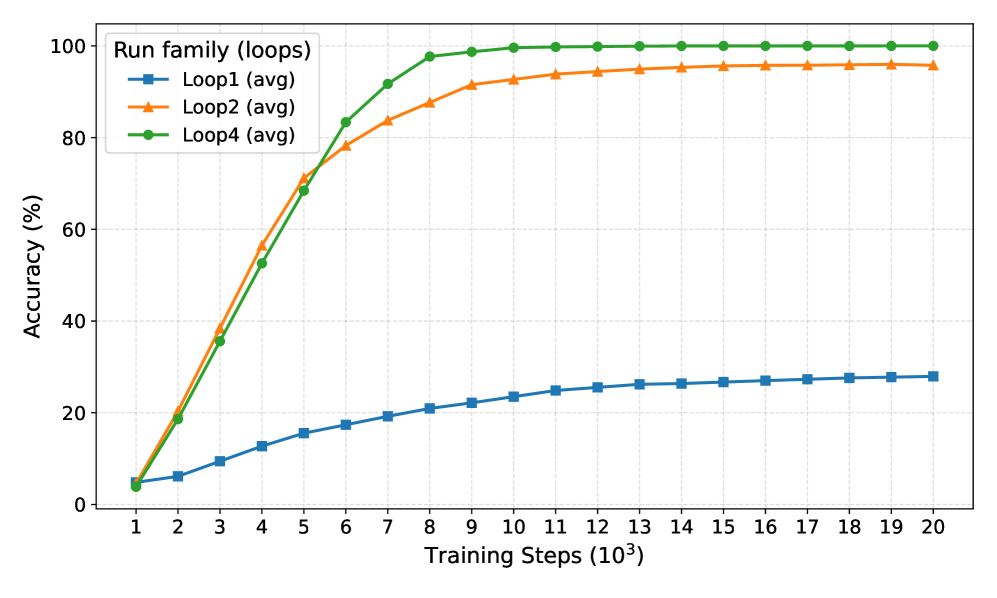
The graph depicts the convergence behavior of three distinct loop configurations (Loop1, Loop2, Loop4) across 20,000 training steps (1k-20k). Accuracy is measured in percentage, with all three configurations showing different rates of improvement and plateauing patterns.
### Components/Axes
- **X-axis**: Training Steps (10³) ranging from 1 to 20 (logarithmic scale)
- **Y-axis**: Accuracy (%) from 0 to 100
- **Legend**: Located in top-left corner with color-coded markers:
- Blue squares: Loop1 (avg)
- Orange triangles: Loop2 (avg)
- Green circles: Loop4 (avg)
- **Title**: "Run family (loops)" positioned at the top center
### Detailed Analysis
1. **Loop4 (green circles)**:
- Initial accuracy: ~5% at 1k steps
- Rapid ascent: Reaches 95% by 8k steps
- Plateau: Maintains 98-100% accuracy from 9k-20k steps
- Notable: Fastest convergence with highest final accuracy
2. **Loop2 (orange triangles)**:
- Initial accuracy: ~5% at 1k steps
- Steady growth: Reaches 95% by 16k steps
- Plateau: Maintains 97-98% accuracy from 17k-20k steps
- Notable: Second-fastest convergence but slower than Loop4
3. **Loop1 (blue squares)**:
- Initial accuracy: ~5% at 1k steps
- Gradual improvement: Reaches 28% by 20k steps
- Plateau: Maintains 26-28% accuracy from 15k-20k steps
- Notable: Slowest convergence with lowest final accuracy
### Key Observations
- All configurations start at similar low accuracy (~5%) at 1k steps
- Loop4 demonstrates 3.5x faster convergence than Loop2 (8k vs 16k steps to reach 95%)
- Loop1 shows significantly poorer performance, achieving only 28% accuracy after 20k steps
- All lines exhibit diminishing returns after their respective plateau points
- Green (Loop4) consistently outperforms orange (Loop2) after 8k steps
### Interpretation
The data suggests that loop configuration critically impacts training efficiency:
1. **Loop4's superiority** indicates optimal architectural design for rapid convergence
2. **Loop2's mid-performance** suggests moderate efficiency with room for improvement
3. **Loop1's underperformance** highlights potential architectural limitations
4. The stark divergence between Loop4 and Loop1 implies that loop structure may be a dominant factor in training dynamics
5. All configurations show saturation behavior, suggesting diminishing returns at higher step counts
The graph emphasizes the importance of loop optimization in training pipelines, with Loop4 representing a highly efficient configuration while Loop1 demonstrates suboptimal performance characteristics.