## Bar Chart: Verifier Performance on ProcessBench
### Overview
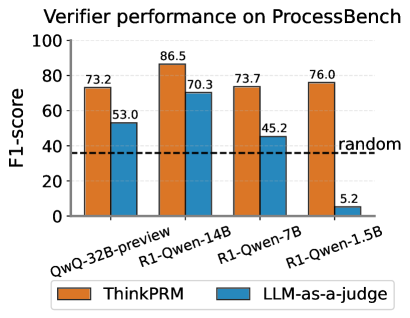
This is a grouped bar chart comparing the performance of two verification methods, "ThinkPRM" and "LLM-as-a-judge," across four different language models on a benchmark called "ProcessBench." Performance is measured using the F1-score metric.
### Components/Axes
* **Chart Title:** "Verifier performance on ProcessBench" (Top center).
* **Y-Axis:** Labeled "F1-score". The scale runs from 0 to 100 in increments of 20 (0, 20, 40, 60, 80, 100).
* **X-Axis:** Lists four model names as categories:
1. QwQ-32B-preview
2. R1-Qwen-14B
3. R1-Qwen-7B
4. R1-Qwen-1.5B
* **Legend:** Located at the bottom center of the chart.
* Orange square: "ThinkPRM"
* Blue square: "LLM-as-a-judge"
* **Baseline:** A horizontal dashed black line labeled "random" is positioned at approximately F1-score = 37.
### Detailed Analysis
The chart displays paired bars for each model, with the orange "ThinkPRM" bar on the left and the blue "LLM-as-a-judge" bar on the right.
**Data Points (F1-scores):**
1. **QwQ-32B-preview:**
* ThinkPRM (Orange): 73.2
* LLM-as-a-judge (Blue): 53.0
2. **R1-Qwen-14B:**
* ThinkPRM (Orange): 86.5 (Highest value in the chart)
* LLM-as-a-judge (Blue): 70.3
3. **R1-Qwen-7B:**
* ThinkPRM (Orange): 73.7
* LLM-as-a-judge (Blue): 45.2
4. **R1-Qwen-1.5B:**
* ThinkPRM (Orange): 76.0
* LLM-as-a-judge (Blue): 5.2 (Lowest value in the chart)
**Trend Verification:**
* **ThinkPRM (Orange Bars):** The performance is relatively stable and high across all models, ranging from 73.2 to 86.5. The trend line is roughly flat with a peak at the R1-Qwen-14B model.
* **LLM-as-a-judge (Blue Bars):** Shows a clear and steep downward trend as the model size decreases (from left to right on the x-axis). Performance drops from 70.3 with the 14B model to just 5.2 with the 1.5B model.
### Key Observations
1. **Consistent Superiority:** ThinkPRM outperforms LLM-as-a-judge on every single model tested.
2. **Performance Gap:** The performance gap between the two methods widens dramatically as the model size decreases. The gap is smallest for the largest model (QwQ-32B-preview: 20.2 points) and largest for the smallest model (R1-Qwen-1.5B: 70.8 points).
3. **Critical Failure Point:** The LLM-as-a-judge method performs worse than the random baseline (37) for the smallest model (R1-Qwen-1.5B), with an F1-score of only 5.2.
4. **Peak Performance:** The highest overall score (86.5) is achieved by ThinkPRM using the R1-Qwen-14B model.
### Interpretation
The data strongly suggests that **ThinkPRM is a significantly more robust and effective verification method than LLM-as-a-judge** for the ProcessBench task. Its performance is less sensitive to the underlying model's scale, maintaining high effectiveness even with smaller models.
The **LLM-as-a-judge method appears to be highly dependent on the capability of the base model**. Its performance degrades severely with smaller models, to the point of being practically useless (F1=5.2) for the 1.5B parameter model, falling far below random chance. This indicates a fundamental limitation in using a less capable LLM to judge or verify outputs, likely due to its own lack of reasoning or comprehension depth.
The "random" baseline provides a crucial reference point, highlighting that while both methods are generally better than chance, the LLM-as-a-judge approach fails this basic test at the smallest model scale. The chart makes a compelling case for the adoption of ThinkPRM-like verification techniques, especially in resource-constrained scenarios involving smaller language models.