## Line Graph: Accuracy Comparison of Baseline vs. Curriculum Learning
### Overview
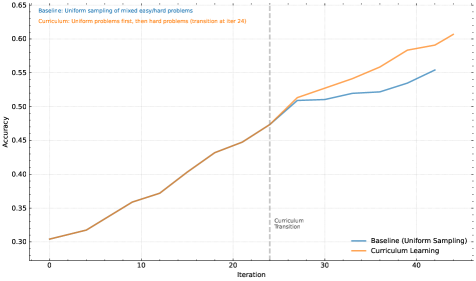
The graph compares the accuracy of two learning approaches over 40 iterations:
1. **Baseline**: Uniform sampling of mixed easy/hard problems
2. **Curriculum Learning**: Uniform problems first, then hard problems (transition at iteration 24)
Accuracy is plotted on the y-axis (0.30–0.65), and iterations on the x-axis (0–40). A vertical dashed line marks the curriculum transition at iteration 24.
---
### Components/Axes
- **X-axis (Iteration)**: Labeled "Iteration," ranging from 0 to 40.
- **Y-axis (Accuracy)**: Labeled "Accuracy," ranging from 0.30 to 0.65.
- **Legend**: Located at the bottom-right corner.
- **Blue line**: Baseline (Uniform Sampling)
- **Orange line**: Curriculum Learning
- **Vertical Dashed Line**: Positioned at iteration 24, labeled "Curriculum Transition."
---
### Detailed Analysis
1. **Baseline (Blue Line)**:
- Starts at ~0.30 accuracy at iteration 0.
- Gradually increases to ~0.55 by iteration 40.
- Slope is relatively flat until iteration 24, then accelerates slightly.
2. **Curriculum Learning (Orange Line)**:
- Starts at ~0.31 accuracy at iteration 0.
- Accelerates sharply after iteration 24, reaching ~0.60 by iteration 40.
- Crosses the Baseline line at ~iteration 24, overtaking it thereafter.
3. **Key Data Points**:
- **Baseline**:
- Iteration 0: 0.30
- Iteration 24: ~0.50
- Iteration 40: 0.55
- **Curriculum Learning**:
- Iteration 0: 0.31
- Iteration 24: ~0.50 (crosses Baseline here)
- Iteration 40: 0.60
---
### Key Observations
- **Curriculum Learning outperforms Baseline** after iteration 24, achieving higher accuracy by iteration 40 (0.60 vs. 0.55).
- Both methods show improvement over time, but Curriculum Learning’s growth rate increases significantly post-transition.
- The vertical dashed line at iteration 24 aligns with the crossover point, confirming the transition’s impact.
---
### Interpretation
The data demonstrates that **Curriculum Learning**—which prioritizes easier problems initially before transitioning to harder ones—achieves superior accuracy compared to uniform sampling of mixed problems. The transition at iteration 24 acts as a critical inflection point, where the curriculum method begins to outperform the baseline. This suggests that structured problem sequencing (e.g., starting with simpler tasks) can enhance learning efficiency, particularly in later stages. The Baseline method’s slower, steadier improvement highlights the limitations of uniform sampling in complex, heterogeneous problem sets.