\n
## Diagram: Latent Variable and Graphical Model Discovery Pipeline
### Overview
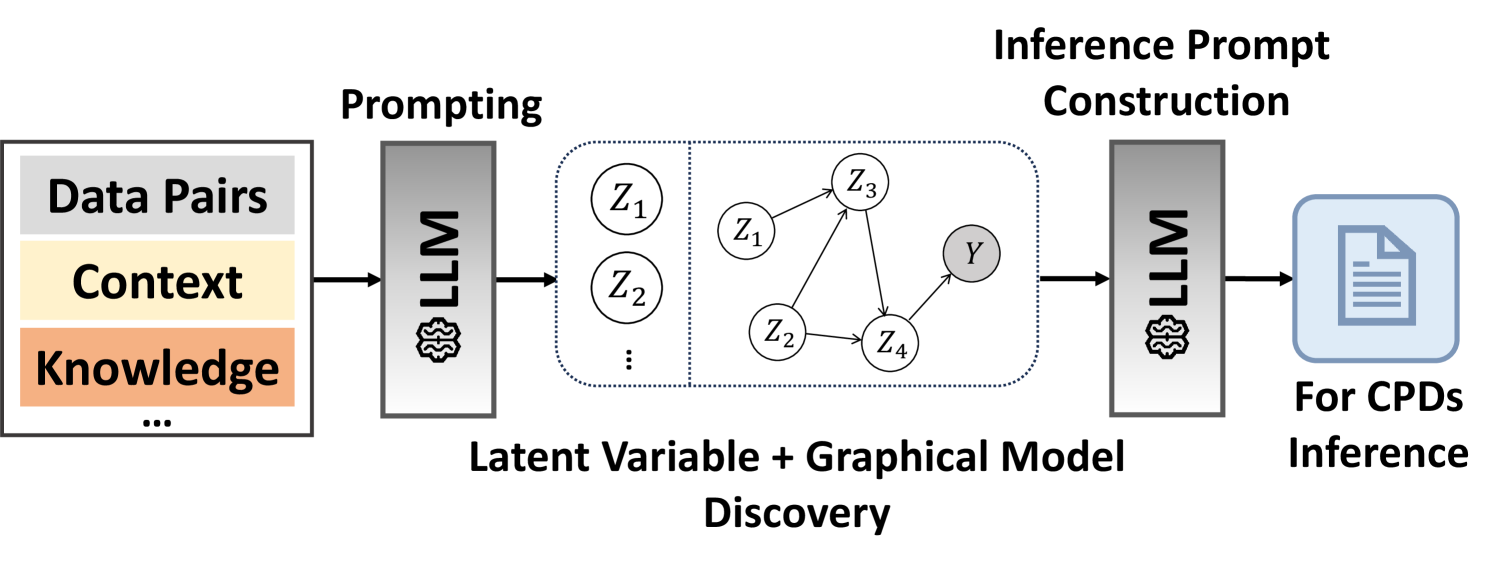
The image depicts a pipeline for latent variable and graphical model discovery, utilizing Large Language Models (LLMs) at two stages: prompting and inference prompt construction. The pipeline takes data pairs, context, and knowledge as input, processes them through an LLM to discover a latent variable graphical model, and then uses another LLM to construct an inference prompt for Conditional Probability Distributions (CPDs) inference.
### Components/Axes
The diagram consists of three main sections, arranged horizontally from left to right:
1. **Input:** A rectangular block labeled "Data Pairs, Context, Knowledge..."
2. **Latent Variable + Graphical Model Discovery:** A rectangular block containing a graphical model with nodes labeled Z1, Z2, Z3, Z4, and Y, connected by directed edges. This block is labeled "Latent Variable + Graphical Model Discovery".
3. **Inference Prompt Construction:** A rectangular block labeled "Inference Prompt Construction" leading to an output labeled "For CPDs Inference".
Two LLM blocks are present, one between the input and the graphical model discovery block, and another between the graphical model discovery block and the inference prompt construction block.
### Detailed Analysis or Content Details
The input block contains the following labels:
* "Data Pairs"
* "Context"
* "Knowledge"
* "..." (indicating more inputs)
The graphical model within the "Latent Variable + Graphical Model Discovery" block consists of five nodes:
* Z1
* Z2
* Z3
* Z4
* Y
The connections (directed edges) are as follows:
* Z1 -> Z2
* Z1 -> Z3
* Z2 -> Y
* Z4 -> Y
* Z3 -> Z4
The output block is labeled "For CPDs Inference" and depicts a document icon.
### Key Observations
The diagram illustrates a two-stage process. The first stage uses an LLM to transform input data into a graphical model representing latent variables and their relationships. The second stage uses another LLM to generate an inference prompt, presumably for calculating CPDs based on the discovered graphical model. The diagram does not provide any numerical data or specific values. It is a conceptual illustration of a process.
### Interpretation
This diagram represents a novel approach to probabilistic modeling. Traditionally, graphical models are constructed by domain experts or through complex statistical algorithms. This pipeline proposes leveraging the reasoning capabilities of LLMs to automate the discovery of latent variable structures from raw data, context, and knowledge. The use of an LLM for inference prompt construction suggests a further integration of LLMs into the inference process, potentially enabling more flexible and interpretable probabilistic reasoning. The diagram highlights the potential of LLMs to bridge the gap between unstructured data and structured probabilistic models. The "..." in the input block suggests that the pipeline can accommodate various types of input data beyond just data pairs, context, and knowledge. The final output, "For CPDs Inference," indicates that the ultimate goal is to perform probabilistic inference using the discovered model.