\n
## Bar Chart: Latency Comparison of Decoding Methods
### Overview
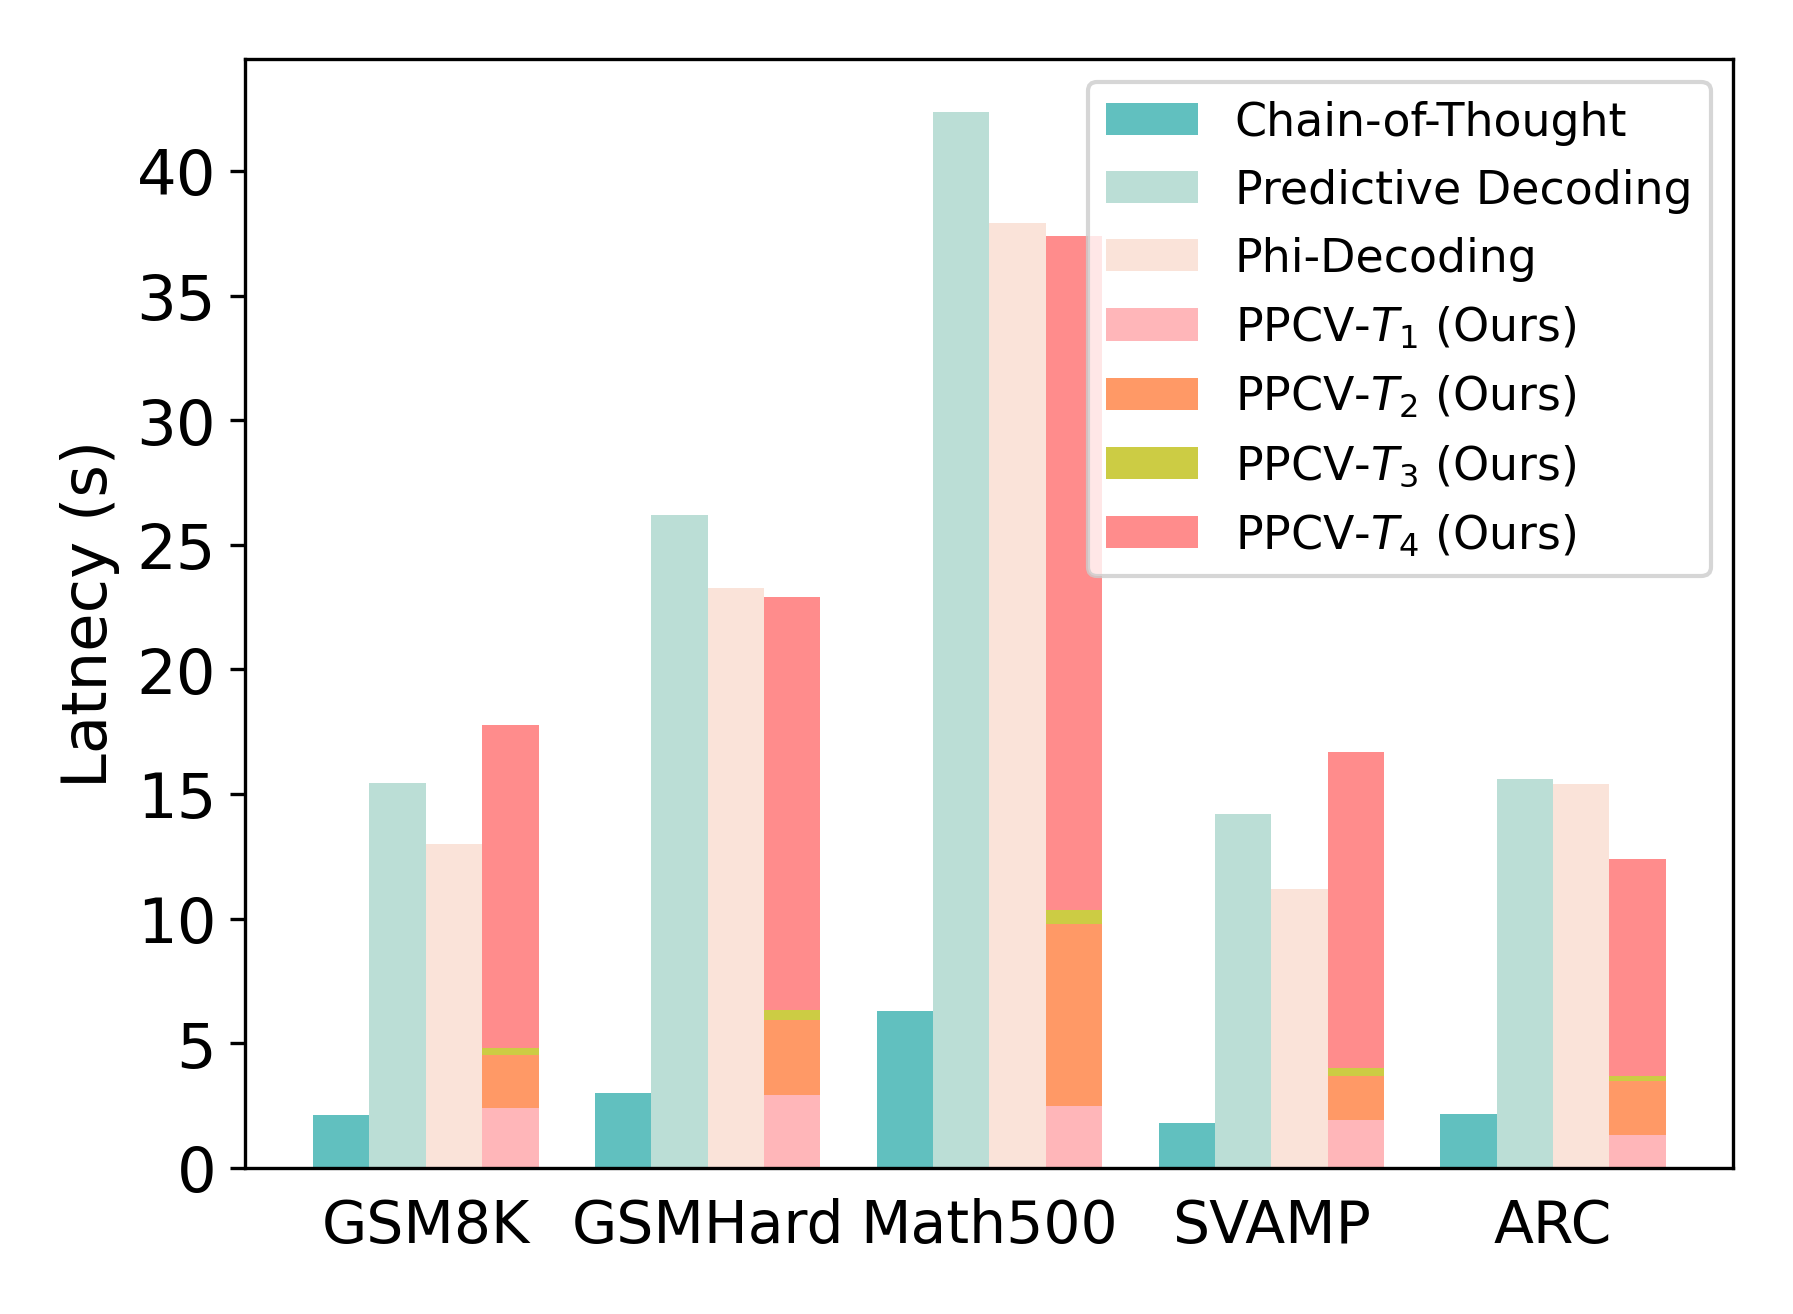
This bar chart compares the latency (in seconds) of several decoding methods – Chain-of-Thought, Predictive Decoding, Phi-Decoding, and four variations of PPCV (PPCV-T1 to PPCV-T4) – across five different datasets: GSM8K, GSMHard, Math500, SVAMP, and ARC. The chart uses stacked bars to represent the contribution of each decoding method to the total latency for each dataset.
### Components/Axes
* **X-axis:** Datasets - GSM8K, GSMHard, Math500, SVAMP, ARC.
* **Y-axis:** Latency (s) - Scale ranges from 0 to 40 seconds, with increments of 5 seconds.
* **Legend (Top-Right):**
* Chain-of-Thought (Light Teal)
* Predictive Decoding (Medium Teal)
* Phi-Decoding (Light Orange)
* PPCV-T1 (Ours) (Medium Orange)
* PPCV-T2 (Ours) (Dark Orange)
* PPCV-T3 (Ours) (Yellow)
* PPCV-T4 (Ours) (Pink)
### Detailed Analysis
Here's a breakdown of the latency values for each dataset and decoding method, based on the bar heights. Note that these are approximate values read from the chart.
* **GSM8K:**
* Chain-of-Thought: ~15s
* Predictive Decoding: ~2s
* Phi-Decoding: ~0.5s
* PPCV-T1: ~1s
* PPCV-T2: ~0.5s
* PPCV-T3: ~0.2s
* PPCV-T4: ~0.2s
* Total: ~19.4s
* **GSMHard:**
* Chain-of-Thought: ~24s
* Predictive Decoding: ~3s
* Phi-Decoding: ~1s
* PPCV-T1: ~1.5s
* PPCV-T2: ~0.5s
* PPCV-T3: ~0.3s
* PPCV-T4: ~0.3s
* Total: ~30.6s
* **Math500:**
* Chain-of-Thought: ~42s
* Predictive Decoding: ~2s
* Phi-Decoding: ~0.5s
* PPCV-T1: ~1.5s
* PPCV-T2: ~0.5s
* PPCV-T3: ~0.2s
* PPCV-T4: ~0.2s
* Total: ~46.9s
* **SVAMP:**
* Chain-of-Thought: ~13s
* Predictive Decoding: ~2s
* Phi-Decoding: ~0.5s
* PPCV-T1: ~1.5s
* PPCV-T2: ~0.5s
* PPCV-T3: ~0.2s
* PPCV-T4: ~0.2s
* Total: ~17.9s
* **ARC:**
* Chain-of-Thought: ~15s
* Predictive Decoding: ~2s
* Phi-Decoding: ~0.5s
* PPCV-T1: ~1.5s
* PPCV-T2: ~0.5s
* PPCV-T3: ~0.2s
* PPCV-T4: ~0.2s
* Total: ~19.9s
**Trends:**
* Chain-of-Thought consistently contributes the largest portion of latency across all datasets.
* PPCV-T3 and PPCV-T4 have very similar, minimal contributions to latency.
* Predictive Decoding and Phi-Decoding contribute relatively small amounts of latency compared to Chain-of-Thought.
* PPCV-T1 and PPCV-T2 contribute slightly more latency than PPCV-T3 and PPCV-T4.
### Key Observations
* The Math500 dataset exhibits the highest overall latency, primarily driven by the Chain-of-Thought method.
* The latency for Chain-of-Thought is significantly higher than all other methods across all datasets.
* The PPCV methods (T1-T4) consistently show low latency contributions.
* The differences in latency between the PPCV methods are relatively small.
### Interpretation
The chart demonstrates a clear trade-off between decoding method and latency. Chain-of-Thought, while potentially offering higher accuracy or quality of results (not shown in this chart), incurs a substantial latency cost. The PPCV methods, particularly T3 and T4, appear to offer a significant reduction in latency, albeit potentially at the expense of performance on the tasks. The consistent pattern across datasets suggests that this latency difference is inherent to the decoding methods themselves and not specific to the characteristics of the datasets. The "Ours" label on PPCV-T1 through PPCV-T4 indicates these methods were developed by the authors of the study, and the chart serves to highlight their efficiency gains compared to established methods like Chain-of-Thought, Predictive Decoding, and Phi-Decoding. The stacked bar format effectively visualizes the composition of total latency, allowing for a clear comparison of the contribution of each method.