## Stacked Bar Chart: GPT-2 xl Attention Head Distribution by Layer Range
### Overview
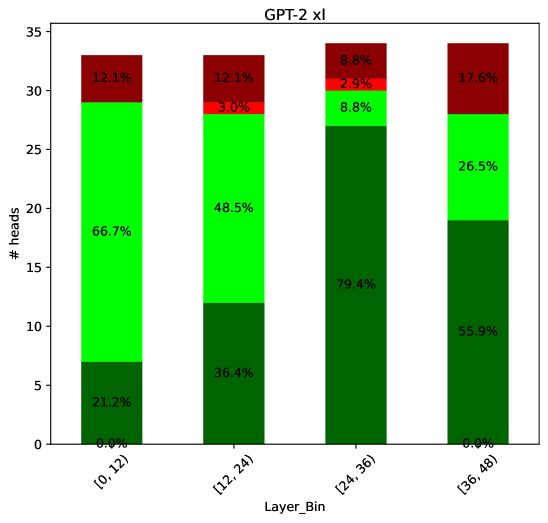
This is a stacked bar chart titled "GPT-2 xl". It visualizes the distribution of attention heads across four contiguous layer ranges (bins) of the GPT-2 xl model. Each bar represents a layer range, and the segments within each bar show the percentage of heads falling into four distinct categories, indicated by color. The y-axis represents the absolute count of heads ("# heads").
### Components/Axes
* **Chart Title:** "GPT-2 xl" (centered at the top).
* **X-Axis:**
* **Label:** "Layer_Bin"
* **Categories (Bins):** Four discrete layer ranges:
1. `[0, 12)`
2. `[12, 24)`
3. `[24, 36)`
4. `[36, 48)`
* **Y-Axis:**
* **Label:** "# heads"
* **Scale:** Linear scale from 0 to 35, with major tick marks at intervals of 5.
* **Legend:** Located in the top-right corner of the plot area. It defines four color-coded categories with associated percentage ranges:
* **Dark Green:** `0.0% - 25.0%`
* **Bright Green:** `25.0% - 50.0%`
* **Red:** `50.0% - 75.0%`
* **Dark Red:** `75.0% - 100.0%`
* **Data Labels:** Each colored segment within the bars contains a text label indicating its exact percentage value.
### Detailed Analysis
The chart displays data for four layer bins. The total height of each bar represents the total number of attention heads in that layer range, which appears to be approximately 33-34 heads per bin.
**Bin 1: [0, 12)**
* **Dark Green (0.0% - 25.0%):** 21.2% (Bottom segment)
* **Bright Green (25.0% - 50.0%):** 66.7% (Middle segment)
* **Red (50.0% - 75.0%):** 0.0% (Not visible)
* **Dark Red (75.0% - 100.0%):** 12.1% (Top segment)
* **Trend:** Dominated by the Bright Green category (66.7%).
**Bin 2: [12, 24)**
* **Dark Green (0.0% - 25.0%):** 36.4% (Bottom segment)
* **Bright Green (25.0% - 50.0%):** 48.5% (Middle segment)
* **Red (50.0% - 75.0%):** 3.0% (Thin segment above Bright Green)
* **Dark Red (75.0% - 100.0%):** 12.1% (Top segment)
* **Trend:** Bright Green remains the largest segment (48.5%), but Dark Green has increased notably from the first bin.
**Bin 3: [24, 36)**
* **Dark Green (0.0% - 25.0%):** 79.4% (Bottom segment, very large)
* **Bright Green (25.0% - 50.0%):** 8.8% (Small segment above Dark Green)
* **Red (50.0% - 75.0%):** 2.9% (Thin segment above Bright Green)
* **Dark Red (75.0% - 100.0%):** 8.8% (Top segment)
* **Trend:** Dramatic shift. Dark Green becomes overwhelmingly dominant (79.4%). Bright Green shrinks significantly.
**Bin 4: [36, 48)**
* **Dark Green (0.0% - 25.0%):** 55.9% (Bottom segment)
* **Bright Green (25.0% - 50.0%):** 26.5% (Middle segment)
* **Red (50.0% - 75.0%):** 0.0% (Not visible)
* **Dark Red (75.0% - 100.0%):** 17.6% (Top segment)
* **Trend:** Dark Green decreases from its peak but remains the majority (55.9%). Bright Green recovers somewhat. Dark Red reaches its highest percentage (17.6%).
### Key Observations
1. **Dominant Category Shift:** The primary category shifts from Bright Green (25-50%) in early layers to Dark Green (0-25%) in middle layers, before partially reverting in the final layers.
2. **Peak of Dark Green:** The `[24, 36)` layer bin shows an extreme concentration (79.4%) of heads in the lowest percentage bracket (Dark Green, 0-25%).
3. **Minimal "Red" Category:** The Red category (50-75%) is negligible, appearing only as thin slivers (2.9-3.0%) in the two middle bins and absent elsewhere.
4. **Dark Red Consistency:** The Dark Red category (75-100%) maintains a presence across all bins, ranging from 8.8% to 17.6%, with its highest value in the final bin.
5. **Total Head Count:** The total number of heads per layer bin appears consistent, visually estimated at ~33-34 heads.
### Interpretation
This chart likely illustrates the distribution of some metric (e.g., attention entropy, specialization score, or activation sparsity) across the attention heads within different layers of the GPT-2 xl model. The percentages in the legend (0-25%, 25-50%, etc.) categorize heads based on this metric's value.
The data suggests a **non-uniform functional organization** across the model's depth:
* **Early Layers ([0,12)):** Heads are moderately active or specialized (majority in the 25-50% bracket).
* **Middle Layers ([24,36)):** A dramatic shift occurs where the vast majority of heads fall into the lowest bracket (0-25%). This could indicate a region of the model where attention heads are highly specialized, sparse, or focused on very specific, low-entropy patterns.
* **Late Layers ([36,48)):** The distribution becomes more mixed again, with a resurgence of heads in the 25-50% bracket and the highest proportion of heads in the top bracket (75-100%). This might reflect a transition to more generalized or integrative processing before the output.
The near-absence of heads in the 50-75% (Red) range is a notable anomaly, suggesting the measured property tends to cluster at the lower or higher ends of the spectrum rather than in the middle. The consistent presence of a small subset of heads in the highest bracket (Dark Red) across all layers may indicate a persistent, specialized role for these heads throughout the network.