## Heatmap: Accuracy Breakdown
### Overview
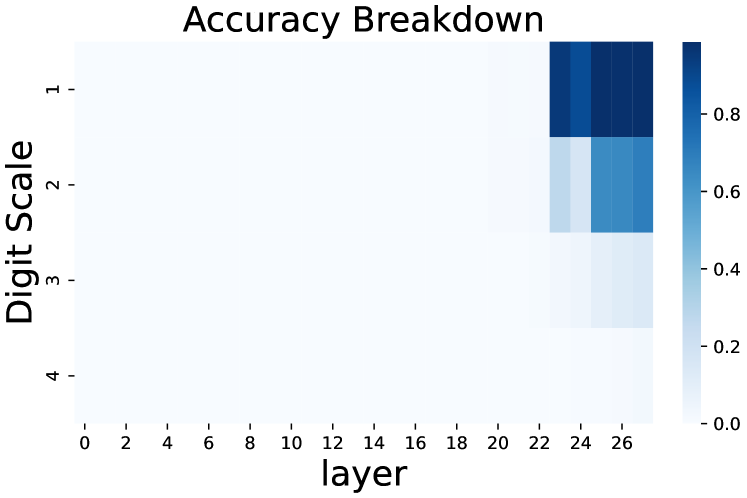
The image presents a heatmap visualizing the accuracy breakdown across different digit scales and layers. The heatmap uses a color gradient to represent accuracy values, ranging from 0.0 (lightest color) to 0.8 (darkest color).
### Components/Axes
* **Title:** "Accuracy Breakdown" - positioned at the top-center of the image.
* **X-axis:** "layer" - ranging from 0 to 28, with markers at every 2 units.
* **Y-axis:** "Digit Scale" - ranging from 1 to 4, with markers at each integer value.
* **Colorbar:** Located on the right side of the heatmap, representing the accuracy scale from 0.0 to 0.8, with a gradient from light blue to dark blue.
### Detailed Analysis
The heatmap displays accuracy values for each combination of digit scale and layer. The color intensity corresponds to the accuracy level.
* **Digit Scale 1:** Accuracy is low for layers 0-22, then rapidly increases to approximately 0.8 for layers 24-28.
* **Digit Scale 2:** Accuracy starts low for layers 0-22, then increases to approximately 0.6-0.7 for layers 24-28.
* **Digit Scale 3:** Accuracy remains consistently low, around 0.2-0.4, across all layers.
* **Digit Scale 4:** Accuracy is very low, around 0.1-0.2, across all layers.
Here's a more detailed breakdown of approximate accuracy values based on color interpretation:
| Digit Scale | Layer 0 | Layer 2 | Layer 4 | Layer 6 | Layer 8 | Layer 10 | Layer 12 | Layer 14 | Layer 16 | Layer 18 | Layer 20 | Layer 22 | Layer 24 | Layer 26 | Layer 28 |
|---|---|---|---|---|---|---|---|---|---|---|---|---|---|---|---|
| 1 | 0.0 | 0.0 | 0.0 | 0.0 | 0.0 | 0.0 | 0.0 | 0.0 | 0.0 | 0.0 | 0.0 | 0.0 | 0.75 | 0.8 | 0.8 |
| 2 | 0.0 | 0.0 | 0.0 | 0.0 | 0.0 | 0.0 | 0.0 | 0.0 | 0.0 | 0.0 | 0.0 | 0.0 | 0.55 | 0.65 | 0.65 |
| 3 | 0.1 | 0.1 | 0.2 | 0.2 | 0.2 | 0.2 | 0.3 | 0.3 | 0.3 | 0.3 | 0.3 | 0.3 | 0.3 | 0.3 | 0.3 |
| 4 | 0.0 | 0.0 | 0.1 | 0.1 | 0.1 | 0.1 | 0.1 | 0.1 | 0.1 | 0.1 | 0.1 | 0.1 | 0.1 | 0.1 | 0.1 |
### Key Observations
* Accuracy is significantly higher for Digit Scale 1 compared to other digit scales.
* Accuracy generally increases with layer number, particularly for Digit Scale 1 and 2.
* Digit Scales 3 and 4 exhibit consistently low accuracy across all layers.
* There is a sharp increase in accuracy for Digit Scale 1 around layer 24.
### Interpretation
The heatmap suggests that the model performs best at recognizing Digit Scale 1, and its performance improves as it progresses through deeper layers (layers 24-28). The consistently low accuracy for Digit Scales 3 and 4 indicates that the model struggles to accurately process these scales, regardless of the layer. This could be due to several factors, such as the complexity of these digits, the quality of the training data, or limitations in the model architecture. The rapid increase in accuracy for Digit Scale 1 around layer 24 might indicate that this layer is crucial for feature extraction or pattern recognition specific to that digit scale. The data suggests a potential need to focus on improving the model's ability to handle Digit Scales 3 and 4, perhaps through data augmentation or architectural modifications.