## Scatter Plot: LLM Performance Comparison Across Datasets
### Overview
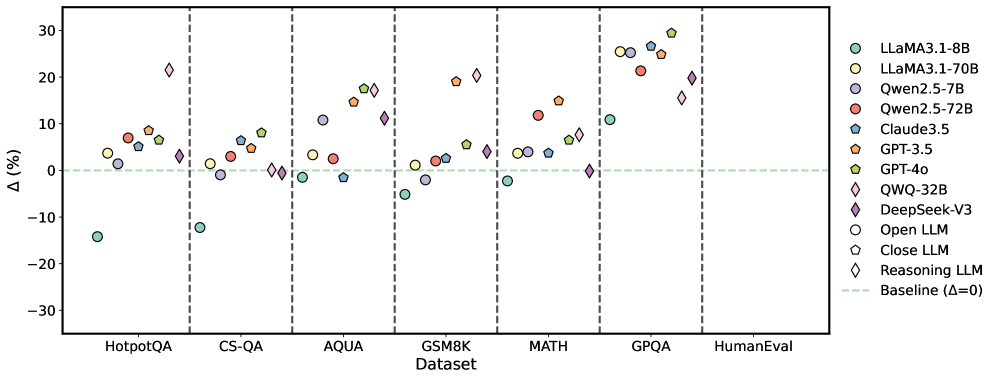
The image is a scatter plot comparing the performance of various Large Language Models (LLMs) across different datasets. The y-axis represents the percentage difference (Δ (%)), and the x-axis represents the datasets. Each LLM is represented by a unique color and marker. A horizontal dashed line indicates the baseline performance (Δ = 0).
### Components/Axes
* **X-axis:** Datasets: HotpotQA, CS-QA, AQUA, GSM8K, MATH, GPQA, HumanEval
* **Y-axis:** Δ (%) - Percentage difference, ranging from -30 to 30, with tick marks at -30, -20, -10, 0, 10, 20, and 30.
* **Legend:** Located on the right side of the plot, mapping colors and markers to specific LLMs:
* Light Blue Circle: LLaMA3.1-8B
* Yellow Circle: LLaMA3.1-70B
* Dark Blue Circle: Qwen2.5-7B
* Red Circle: Qwen2.5-72B
* Teal Pentagon: Claude3.5
* Orange Pentagon: GPT-3.5
* Green Pentagon: GPT-4o
* Light Blue Diamond: QWQ-32B
* Purple Diamond: DeepSeek-V3
* White Circle: Open LLM
* White Pentagon: Close LLM
* White Diamond: Reasoning LLM
* Light Green Dashed Line: Baseline (Δ=0)
### Detailed Analysis
**LLaMA3.1-8B (Light Blue Circle):**
* HotpotQA: Approximately -14%
* CS-QA: Approximately 0%
* AQUA: Approximately 0%
* GSM8K: Approximately -5%
* MATH: Approximately 0%
* GPQA: Approximately 1%
* HumanEval: Approximately -1%
**LLaMA3.1-70B (Yellow Circle):**
* HotpotQA: Approximately 7%
* CS-QA: Approximately 2%
* AQUA: Approximately 15%
* GSM8K: Approximately 2%
* MATH: Approximately 3%
* GPQA: Approximately 2%
* HumanEval: Approximately 5%
**Qwen2.5-7B (Dark Blue Circle):**
* HotpotQA: Approximately 3%
* CS-QA: Approximately 0%
* AQUA: Approximately 1%
* GSM8K: Approximately 3%
* MATH: Approximately 1%
* GPQA: Approximately 3%
* HumanEval: Approximately 3%
**Qwen2.5-72B (Red Circle):**
* HotpotQA: Approximately 8%
* CS-QA: Approximately 4%
* AQUA: Approximately 3%
* GSM8K: Approximately 4%
* MATH: Approximately 4%
* GPQA: Approximately 4%
* HumanEval: Approximately 4%
**Claude3.5 (Teal Pentagon):**
* HotpotQA: Approximately 5%
* CS-QA: Approximately 2%
* AQUA: Approximately 1%
* GSM8K: Approximately 3%
* MATH: Approximately 3%
* GPQA: Approximately 5%
* HumanEval: Approximately 6%
**GPT-3.5 (Orange Pentagon):**
* HotpotQA: Approximately 9%
* CS-QA: Approximately 6%
* AQUA: Approximately 16%
* GSM8K: Approximately 12%
* MATH: Approximately 12%
* GPQA: Approximately 28%
* HumanEval: Approximately 6%
**GPT-4o (Green Pentagon):**
* HotpotQA: Approximately 6%
* CS-QA: Approximately 5%
* AQUA: Approximately 2%
* GSM8K: Approximately 5%
* MATH: Approximately 5%
* GPQA: Approximately 7%
* HumanEval: Approximately 7%
**QWQ-32B (Light Blue Diamond):**
* HotpotQA: Approximately 0%
* CS-QA: Approximately 3%
* AQUA: Approximately 18%
* GSM8K: Approximately 19%
* MATH: Approximately 19%
* GPQA: Approximately 29%
* HumanEval: Approximately 7%
**DeepSeek-V3 (Purple Diamond):**
* HotpotQA: Approximately 1%
* CS-QA: Approximately 11%
* AQUA: Approximately 12%
* GSM8K: Approximately 2%
* MATH: Approximately 2%
* GPQA: Approximately 22%
* HumanEval: Approximately 16%
**Open LLM (White Circle):**
* HotpotQA: Approximately 0%
* CS-QA: Approximately 0%
* AQUA: Approximately 0%
* GSM8K: Approximately 0%
* MATH: Approximately 0%
* GPQA: Approximately 1%
* HumanEval: Approximately 1%
**Close LLM (White Pentagon):**
* HotpotQA: Approximately 0%
* CS-QA: Approximately 0%
* AQUA: Approximately 0%
* GSM8K: Approximately 0%
* MATH: Approximately 0%
* GPQA: Approximately 0%
* HumanEval: Approximately 0%
**Reasoning LLM (White Diamond):**
* CS-QA: Approximately 3%
* AQUA: Approximately 3%
* GSM8K: Approximately 3%
* MATH: Approximately 3%
* GPQA: Approximately 3%
* HumanEval: Approximately 3%
### Key Observations
* LLaMA3.1-8B performs poorly on HotpotQA compared to other datasets.
* GPT-3.5 and QWQ-32B show high performance on GPQA.
* The performance of most models improves from HotpotQA to HumanEval.
* The "Reasoning LLM" consistently scores around 3% across all datasets.
* The "Close LLM" consistently scores around 0% across all datasets.
* The "Open LLM" consistently scores around 0% across all datasets.
### Interpretation
The scatter plot visualizes the relative performance of different LLMs on various benchmark datasets. The percentage difference (Δ) likely represents the improvement or decline in performance compared to a baseline model or a specific metric. The plot highlights the strengths and weaknesses of each model across different tasks. For example, LLaMA3.1-8B struggles with HotpotQA, while GPT-3.5 and QWQ-32B excel at GPQA. The consistent performance of the "Reasoning LLM" suggests it might be specifically designed for reasoning tasks, while the "Open LLM" and "Close LLM" may be base models or control groups. The general trend of increasing performance from HotpotQA to HumanEval could indicate the increasing complexity or relevance of these datasets.