## Histograms: Deepseek-R1 vs Gemini Flash Thinking Performance
### Overview
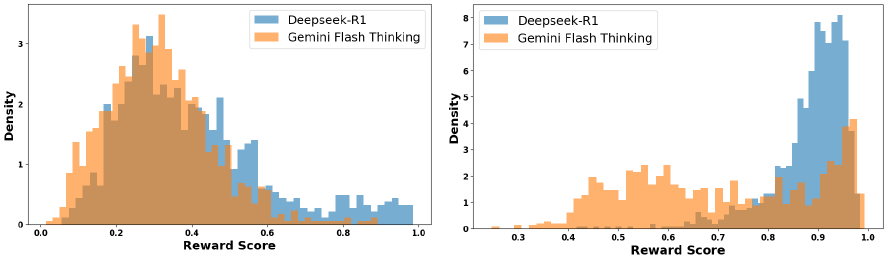
The image contains two side-by-side histograms comparing the reward score distributions of two AI systems: Deepseek-R1 (blue) and Gemini Flash Thinking (orange). The left histogram shows the full distribution range (0.0–1.0), while the right histogram zooms into the higher reward score range (0.3–1.0). Both histograms use density as the y-axis metric.
### Components/Axes
- **X-axis (Reward Score)**:
- Left histogram: 0.0 to 1.0 in 0.1 increments
- Right histogram: 0.3 to 1.0 in 0.1 increments
- **Y-axis (Density)**:
- Left histogram: 0 to 3
- Right histogram: 0 to 8
- **Legends**:
- Positioned in the top-right corner of each histogram
- Blue = Deepseek-R1
- Orange = Gemini Flash Thinking
- **Titles**:
- Left histogram: "Deepseek-R1 vs Gemini Flash Thinking"
- Right histogram: "Deepseek-R1 vs Gemini Flash Thinking (Zoomed)"
### Detailed Analysis
**Left Histogram (Full Range)**:
- **Deepseek-R1 (Blue)**:
- Broad distribution with a peak density of ~2.5 at ~0.3–0.4 reward score
- Gradual decline toward 0.0 and 1.0
- Small secondary peak near 0.8
- **Gemini Flash Thinking (Orange)**:
- Dominant peak density of ~3.0 at ~0.3–0.4
- Longer tail extending to 0.8 with lower density (~1.0)
- Minimal presence below 0.2
**Right Histogram (Zoomed Range)**:
- **Deepseek-R1 (Blue)**:
- Sharp peak density of ~7.0 at ~0.9
- Rapid decline toward 0.3
- Minimal overlap with Gemini Flash
- **Gemini Flash Thinking (Orange)**:
- Peak density of ~4.0 at ~0.7–0.8
- Gradual decline toward 0.3
- No presence below 0.6
### Key Observations
1. **Distribution Contrast**:
- Gemini Flash Thinking dominates mid-range rewards (0.3–0.4) in the full view but shifts to higher rewards (0.7–0.8) in the zoomed view.
- Deepseek-R1 shows stronger performance in the highest reward tier (0.9) in the zoomed view.
2. **Overlap Patterns**:
- Significant overlap in the 0.3–0.4 range in the full histogram, but minimal overlap in the zoomed range.
3. **Density Scaling**:
- Right histogram uses a 2.5x higher y-axis scale (0–8 vs. 0–3) to accommodate deeper distributions.
### Interpretation
The histograms reveal distinct performance characteristics:
- **Gemini Flash Thinking** excels in mid-range rewards (0.3–0.4) but shows diminishing returns in the highest tier (0.9+).
- **Deepseek-R1** demonstrates superior performance in the highest reward bracket (0.9), with a density 75% higher than Gemini Flash in the zoomed view.
- The zoomed histogram emphasizes the divergence in high-reward performance, suggesting Deepseek-R1 may be better optimized for extreme reward scenarios, while Gemini Flash Thinking maintains broader mid-range consistency.
**Notable Anomaly**: The secondary peak in Deepseek-R1's full distribution (~0.8) disappears in the zoomed view, indicating potential data binning artifacts or true performance differentiation at higher reward thresholds.