## Scatter Plot: Law School Admissions
### Overview
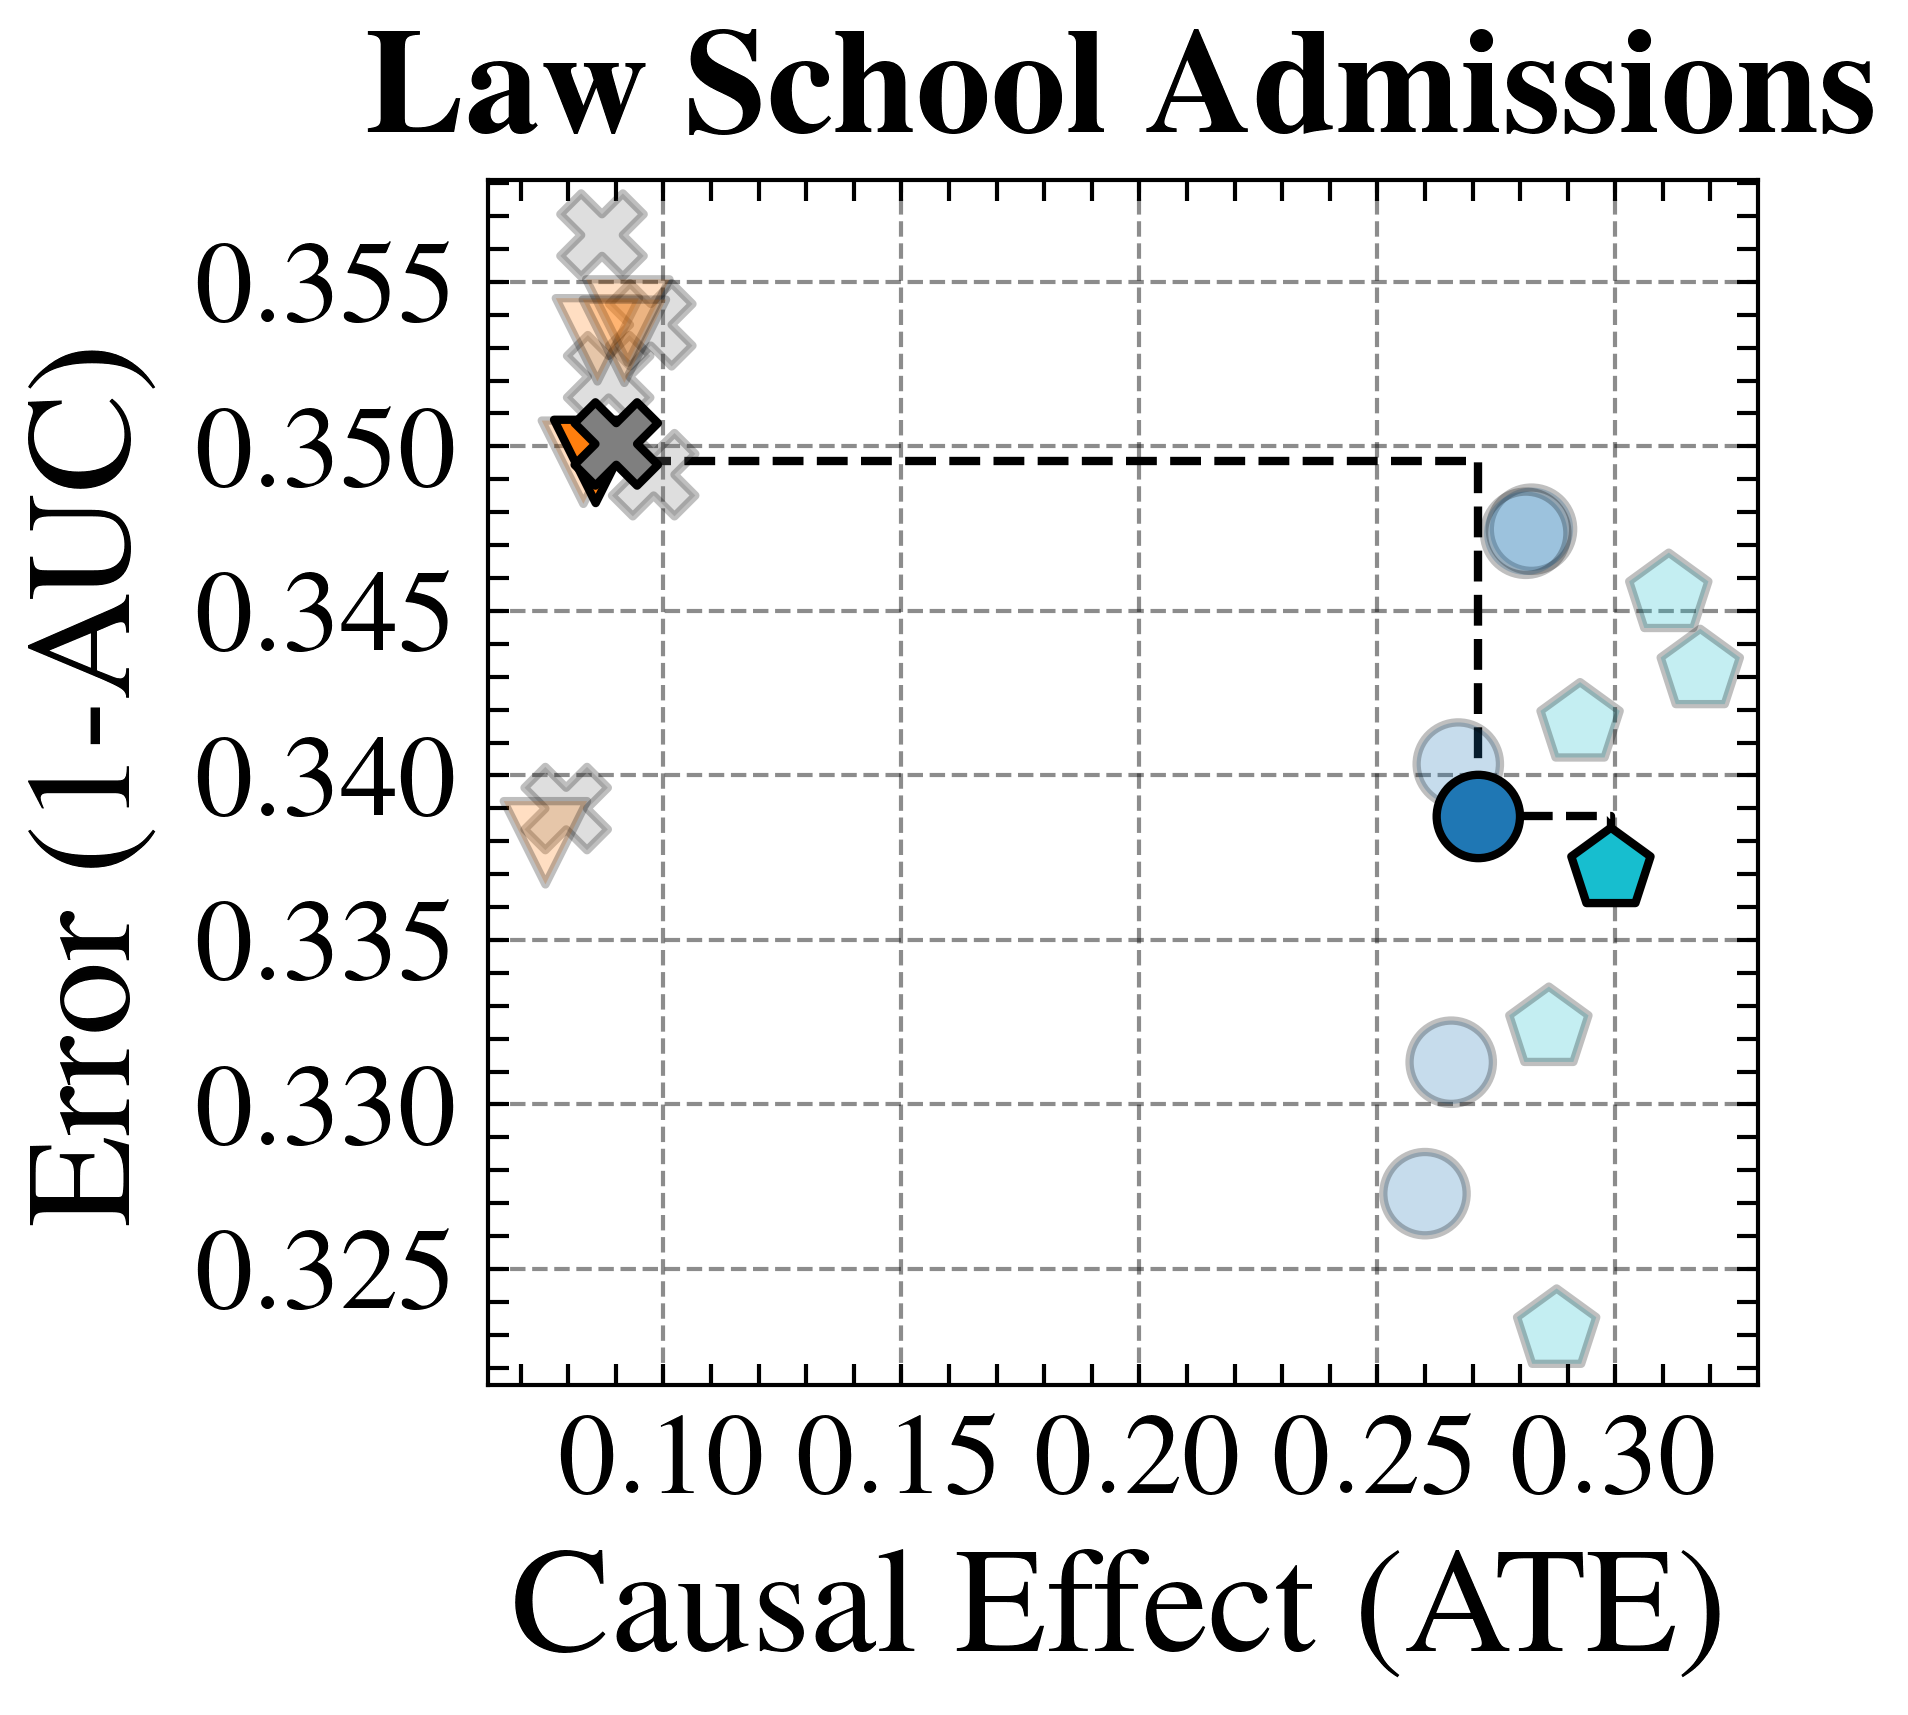
This image presents a scatter plot visualizing the relationship between "Causal Effect (ATE)" and "Error (1-AUC)". The plot appears to represent the performance of different models or methods in the context of law school admissions, likely evaluating their ability to predict outcomes while accounting for causal effects. Data points are differentiated by shape and color, though the exact meaning of these distinctions isn't immediately clear without a legend. A dashed horizontal line is present at Error (1-AUC) = 0.35. A dashed vertical line is present at Causal Effect (ATE) = 0.25.
### Components/Axes
* **Title:** "Law School Admissions" (centered at the top)
* **X-axis:** "Causal Effect (ATE)" - ranging from approximately 0.08 to 0.32.
* **Y-axis:** "Error (1-AUC)" - ranging from approximately 0.325 to 0.355.
* **Data Points:** Scatter plot points with varying shapes (circles, diamonds, triangles, crosses, and 'x' shapes) and colors (various shades of blue and gray).
* **Horizontal Dashed Line:** Located at approximately Error (1-AUC) = 0.35.
* **Vertical Dashed Line:** Located at approximately Causal Effect (ATE) = 0.25.
* **Grid:** A light gray grid is present to aid in reading values.
### Detailed Analysis
The scatter plot contains approximately 15 data points. I will describe the trends and approximate values, noting uncertainty due to the resolution of the image.
* **Trend 1 (Dark Blue Circles):** A cluster of dark blue circles shows a general downward trend.
* Point 1: (0.27, 0.34)
* Point 2: (0.28, 0.335)
* Point 3: (0.25, 0.34)
* **Trend 2 (Light Blue Circles):** A group of light blue circles shows a general downward trend.
* Point 1: (0.26, 0.33)
* Point 2: (0.29, 0.325)
* Point 3: (0.30, 0.33)
* **Trend 3 (Gray Diamonds):** A cluster of gray diamonds shows a relatively flat trend.
* Point 1: (0.11, 0.35)
* Point 2: (0.12, 0.34)
* Point 3: (0.10, 0.335)
* **Trend 4 (Gray 'x' shapes):** A cluster of gray 'x' shapes shows a relatively flat trend.
* Point 1: (0.31, 0.345)
* Point 2: (0.30, 0.34)
* Point 3: (0.31, 0.335)
* **Trend 5 (Light Gray Triangles):** A cluster of light gray triangles shows a relatively flat trend.
* Point 1: (0.24, 0.33)
* Point 2: (0.25, 0.325)
* Point 3: (0.27, 0.33)
* **Outlier 1 (Dark Blue Diamond):** (0.11, 0.335)
* **Outlier 2 (Gray Circle):** (0.28, 0.325)
### Key Observations
* The majority of data points cluster towards the lower-right portion of the plot, indicating a negative correlation between Causal Effect (ATE) and Error (1-AUC). Higher causal effect generally corresponds to lower error.
* The dashed lines at 0.35 (Error) and 0.25 (Causal Effect) appear to divide the plot into quadrants, potentially highlighting areas of "good" or "bad" performance.
* The different shapes and colors likely represent different methods or models, but the legend is missing.
* There is a noticeable spread in the data, suggesting that the relationship between causal effect and error is not perfectly deterministic.
### Interpretation
The plot suggests that methods with a higher "Causal Effect (ATE)" tend to have lower "Error (1-AUC)" in the context of law school admissions. This implies that accounting for causal effects in the modeling process improves predictive accuracy. The dashed lines may represent thresholds for acceptable performance. The variation in data points, represented by different shapes and colors, suggests that different methods achieve varying levels of performance. The lack of a legend makes it difficult to determine the specific meaning of each shape/color. The outlier points may represent methods that perform unexpectedly well or poorly given their causal effect. Further investigation would be needed to understand the specific methods represented by each data point and the reasons for the observed variations. The plot is likely used to compare the effectiveness of different causal inference or machine learning techniques applied to the law school admissions problem.