\n
## Scatter Plot: Confidence vs. Target Length for Public Relations
### Overview
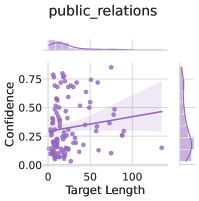
The image presents a scatter plot visualizing the relationship between "Target Length" and "Confidence" specifically for the category "public_relations". A regression line with a confidence interval is overlaid on the scatter points, and marginal distributions are shown above and to the right of the main plot.
### Components/Axes
* **Title:** "public\_relations" (top-center)
* **X-axis:** "Target Length" (bottom-center), ranging from approximately 0 to 110.
* **Y-axis:** "Confidence" (left-center), ranging from approximately 0.00 to 0.75.
* **Scatter Points:** Numerous purple dots representing individual data points.
* **Regression Line:** A purple line representing the trend of the data. It slopes slightly upwards.
* **Confidence Interval:** A shaded purple area around the regression line, indicating the uncertainty in the estimated trend.
* **Marginal Distribution (Top):** A density plot showing the distribution of "Target Length".
* **Marginal Distribution (Right):** A density plot showing the distribution of "Confidence".
### Detailed Analysis
The scatter plot shows a weak positive correlation between "Target Length" and "Confidence" for "public\_relations".
* **Scatter Points:** The points are widely dispersed, indicating a moderate amount of variance. Most points cluster between "Target Length" values of 0 and 75, and "Confidence" values of 0.15 and 0.65. There are a few outliers with "Confidence" values above 0.65.
* **Regression Line:** The line has a positive slope, suggesting that as "Target Length" increases, "Confidence" tends to increase, but the effect is small. The line starts at approximately "Target Length" = 0 and "Confidence" = 0.25, and ends at approximately "Target Length" = 110 and "Confidence" = 0.45.
* **Confidence Interval:** The confidence interval is relatively wide, indicating a high degree of uncertainty in the estimated regression line.
* **Marginal Distribution (Top):** The distribution of "Target Length" is skewed to the right, with a peak around a value of 10.
* **Marginal Distribution (Right):** The distribution of "Confidence" is roughly bell-shaped, with a peak around a value of 0.25.
### Key Observations
* The relationship between "Target Length" and "Confidence" is weak.
* There is a considerable amount of variability in "Confidence" for a given "Target Length".
* The marginal distributions suggest that "Target Length" values are generally low, while "Confidence" values are centered around 0.25.
* The confidence interval is wide, indicating that the regression line is not a precise estimate of the true relationship.
### Interpretation
The data suggests that, for the "public\_relations" category, there is a slight tendency for higher "Target Length" to be associated with higher "Confidence", but this relationship is not strong. The wide confidence interval indicates that other factors likely play a more significant role in determining "Confidence". The marginal distributions provide context, showing that "Target Length" is generally short, and "Confidence" is relatively low. The scatter plot and associated statistics provide a quantitative assessment of the relationship between these two variables within the context of public relations. The data does not suggest a strong predictive power of "Target Length" on "Confidence".