## Line Chart: Test Accuracy vs. Number of Shots
### Overview
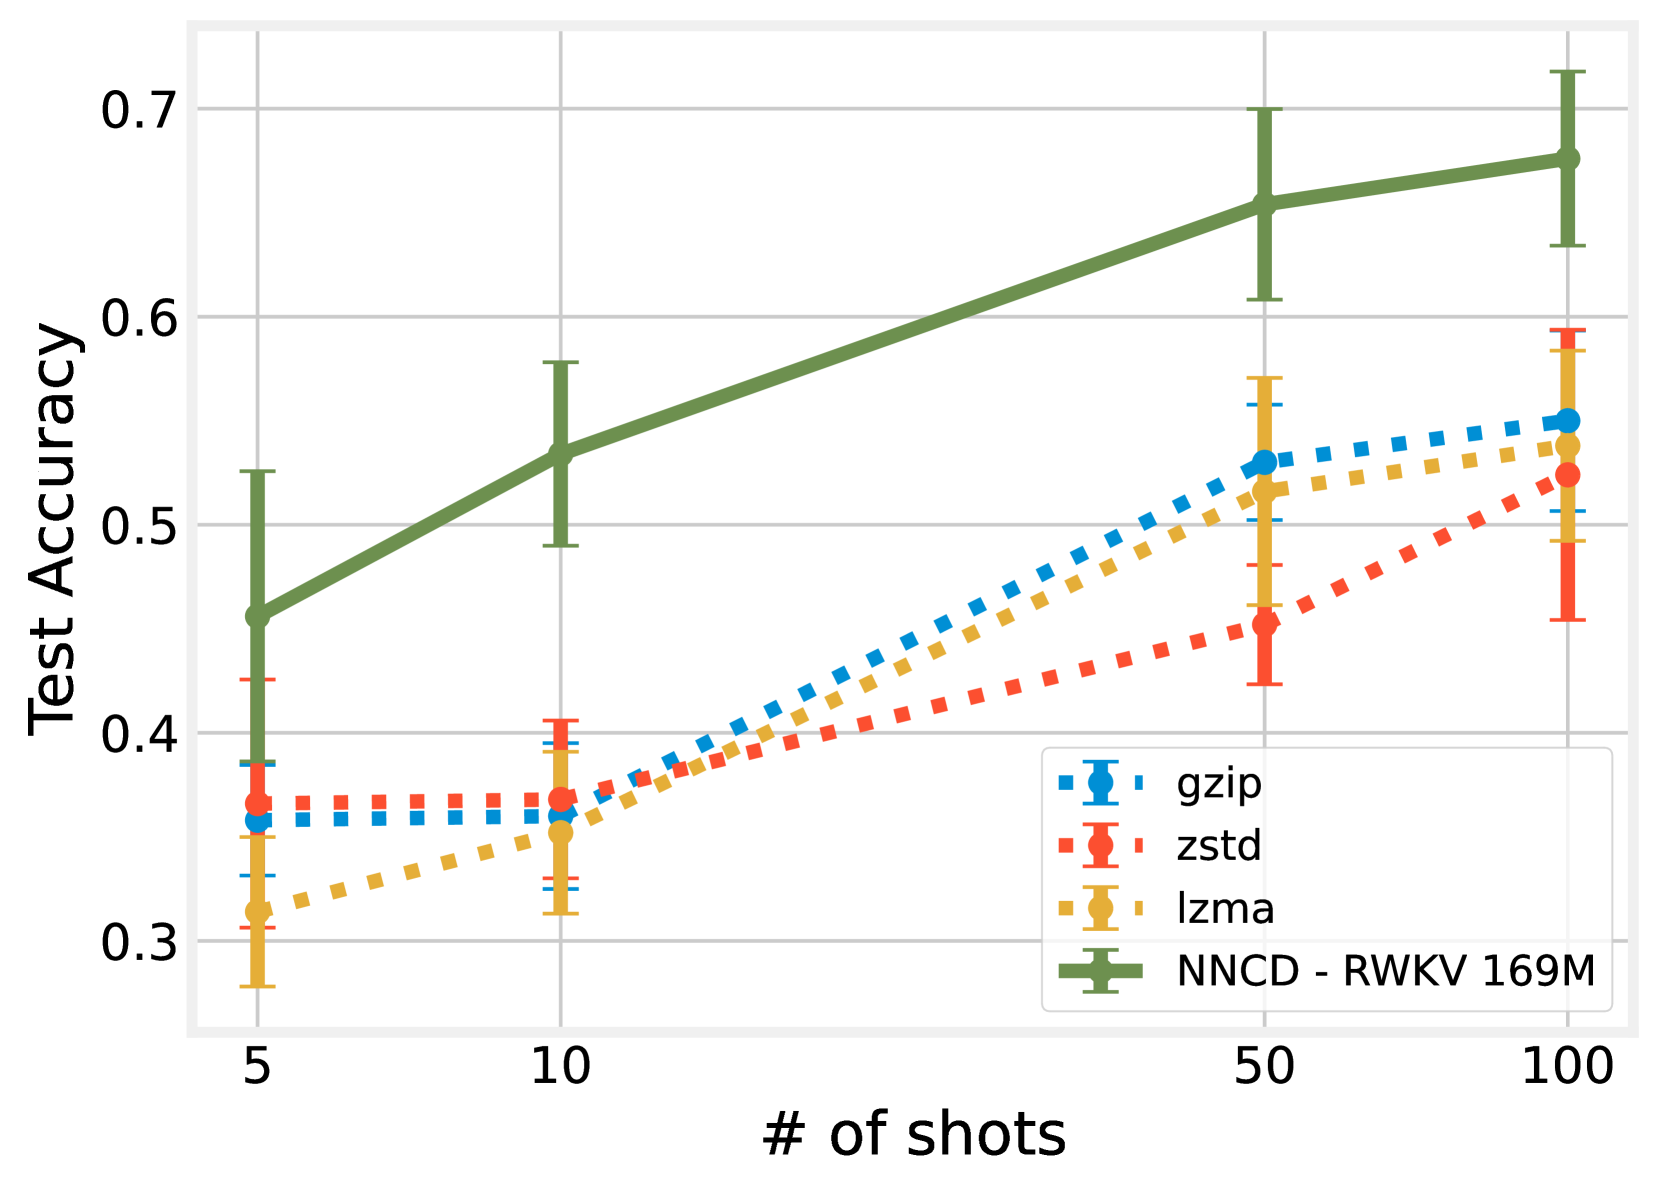
The chart compares the test accuracy of four models (gzip, zstd, lzma, and NNC-D - RWKV 169M) across different numbers of training shots (5, 10, 50, 100). Test accuracy increases with the number of shots for all models, with NNC-D consistently outperforming the others. Error bars indicate variability in accuracy measurements.
### Components/Axes
- **X-axis**: Number of shots (5, 10, 50, 100).
- **Y-axis**: Test accuracy (0.3 to 0.7).
- **Legend**:
- **Blue squares**: gzip
- **Red circles**: zstd
- **Orange diamonds**: lzma
- **Green crosses**: NNC-D - RWKV 169M
- **Error bars**: Vertical lines with caps, representing confidence intervals (e.g., ±0.03 to ±0.05).
### Detailed Analysis
1. **NNC-D - RWKV 169M (Green Crosses)**:
- **5 shots**: ~0.45 (±0.05, error range: 0.40–0.50).
- **10 shots**: ~0.53 (±0.06, error range: 0.47–0.59).
- **50 shots**: ~0.65 (±0.06, error range: 0.59–0.71).
- **100 shots**: ~0.68 (±0.05, error range: 0.63–0.73).
2. **gzip (Blue Squares)**:
- **5 shots**: ~0.37 (±0.03, error range: 0.34–0.40).
- **10 shots**: ~0.37 (±0.03, error range: 0.34–0.40).
- **50 shots**: ~0.53 (±0.04, error range: 0.49–0.57).
- **100 shots**: ~0.54 (±0.05, error range: 0.49–0.59).
3. **zstd (Red Circles)**:
- **5 shots**: ~0.38 (±0.03, error range: 0.35–0.41).
- **10 shots**: ~0.38 (±0.03, error range: 0.35–0.41).
- **50 shots**: ~0.46 (±0.04, error range: 0.42–0.50).
- **100 shots**: ~0.52 (±0.05, error range: 0.47–0.57).
4. **lzma (Orange Diamonds)**:
- **5 shots**: ~0.32 (±0.03, error range: 0.29–0.35).
- **10 shots**: ~0.35 (±0.03, error range: 0.32–0.38).
- **50 shots**: ~0.51 (±0.04, error range: 0.47–0.55).
- **100 shots**: ~0.53 (±0.05, error range: 0.48–0.58).
### Key Observations
- **NNC-D dominates**: It achieves the highest accuracy at all shot counts, with a steep upward trend.
- **Other models improve gradually**: gzip, zstd, and lzma show slower progress, with lzma outperforming zstd at higher shots.
- **Error variability**: NNC-D has larger error bars, suggesting higher variability in its performance.
- **Convergence gap**: At 100 shots, NNC-D’s accuracy (~0.68) exceeds others by ~0.15–0.16, but the gap narrows slightly compared to 50 shots.
### Interpretation
The data demonstrates that **NNC-D - RWKV 169M** is significantly more effective than traditional compression algorithms (gzip, zstd, lzma) in this context. Its performance scales strongly with data volume, suggesting it leverages larger datasets more efficiently. While error bars indicate higher variability for NNC-D, its mean accuracy remains superior, making it the optimal choice for high-stakes applications. The slower improvement of traditional models highlights their limitations in handling complex patterns, even with abundant data. This chart likely informs model selection in scenarios where data quantity and accuracy trade-offs are critical.