## Chart: Validation Loss and COCO Caption vs. Training Data Size
### Overview
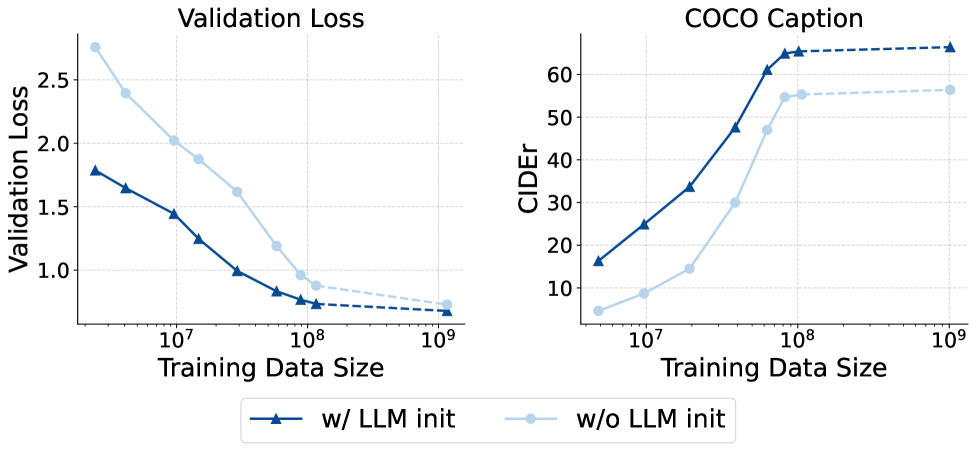
The image presents two line charts comparing the performance of a model with and without LLM initialization. The left chart displays the validation loss as a function of training data size, while the right chart shows the COCO caption CIDEr score versus training data size. Both charts share the same x-axis representing training data size on a logarithmic scale.
### Components/Axes
**Left Chart: Validation Loss**
* **Title:** Validation Loss
* **Y-axis:** Validation Loss (linear scale, ranging from 1.0 to 2.5 in increments of 0.5)
* **X-axis:** Training Data Size (logarithmic scale, ranging from 10^7 to 10^9)
* **Data Series:**
* "w/ LLM init" (dark blue line with triangle markers)
* "w/o LLM init" (light blue line with circle markers)
**Right Chart: COCO Caption**
* **Title:** COCO Caption
* **Y-axis:** CIDEr (linear scale, ranging from 10 to 60 in increments of 10)
* **X-axis:** Training Data Size (logarithmic scale, ranging from 10^7 to 10^9)
* **Data Series:**
* "w/ LLM init" (dark blue line with triangle markers)
* "w/o LLM init" (light blue line with circle markers)
**Legend:**
* Located at the bottom of the image.
* "w/ LLM init": Dark blue line with triangle markers.
* "w/o LLM init": Light blue line with circle markers.
### Detailed Analysis
**Left Chart: Validation Loss**
* **"w/ LLM init" (dark blue, triangles):** The validation loss decreases as the training data size increases.
* At 10^7, the validation loss is approximately 1.8.
* At 10^8, the validation loss is approximately 0.8.
* At 10^9, the validation loss is approximately 0.7 (extrapolated, dashed line).
* **"w/o LLM init" (light blue, circles):** The validation loss also decreases as the training data size increases, but at a slower rate compared to "w/ LLM init".
* At 10^7, the validation loss is approximately 2.7.
* At 10^8, the validation loss is approximately 0.9.
* At 10^9, the validation loss is approximately 0.7 (extrapolated, dashed line).
**Right Chart: COCO Caption**
* **"w/ LLM init" (dark blue, triangles):** The CIDEr score increases rapidly with training data size until it plateaus.
* At 10^7, the CIDEr score is approximately 17.
* At 10^8, the CIDEr score is approximately 63.
* At 10^9, the CIDEr score is approximately 65 (extrapolated, dashed line).
* **"w/o LLM init" (light blue, circles):** The CIDEr score increases with training data size, but remains lower than "w/ LLM init" until it plateaus.
* At 10^7, the CIDEr score is approximately 7.
* At 10^8, the CIDEr score is approximately 55.
* At 10^9, the CIDEr score is approximately 57 (extrapolated, dashed line).
### Key Observations
* The model initialized with LLM ("w/ LLM init") consistently outperforms the model without LLM initialization ("w/o LLM init") in terms of both validation loss and COCO caption CIDEr score.
* The validation loss decreases with increasing training data size for both models.
* The CIDEr score increases with increasing training data size for both models, but plateaus at larger training data sizes.
* The "w/ LLM init" model reaches a higher CIDEr score plateau than the "w/o LLM init" model.
### Interpretation
The data suggests that initializing the model with a Large Language Model (LLM) significantly improves its performance, as evidenced by the lower validation loss and higher CIDEr scores compared to the model without LLM initialization. This indicates that LLM initialization provides a better starting point for training, leading to faster convergence and improved generalization. The plateauing of the CIDEr score at larger training data sizes suggests that there may be a limit to the performance improvement achievable with more data, and other techniques may be needed to further enhance the model's capabilities. The validation loss converging to similar values at 10^9 suggests that both models are approaching their optimal performance with sufficient training data, but the LLM-initialized model achieves this performance more efficiently.