## Diagram: Directed Graph
### Overview
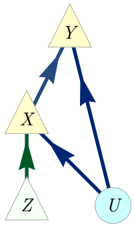
The image depicts a directed graph with four nodes (X, Y, Z, and U) and several directed edges (arrows) connecting them. The nodes X, Y, and Z are represented as triangles, while node U is represented as a circle. The edges are colored either dark blue or dark green, indicating the direction of the relationship between the nodes.
### Components/Axes
* **Nodes:**
* X: Triangle, located in the middle-left of the diagram.
* Y: Triangle, located at the top of the diagram.
* Z: Triangle, located at the bottom-left of the diagram.
* U: Circle, located at the bottom-right of the diagram.
* **Edges (Arrows):**
* Z -> X: Dark green arrow pointing from node Z to node X.
* X -> Y: Dark blue arrow pointing from node X to node Y.
* X -> U: Dark blue arrow pointing from node X to node U.
* Y -> U: Dark blue arrow pointing from node Y to node U.
* U -> Y: Dark blue arrow pointing from node U to node Y.
### Detailed Analysis
* **Node Shapes:** Triangles for X, Y, and Z; Circle for U.
* **Edge Colors:** Dark green for Z -> X; Dark blue for all other edges.
* **Connectivity:**
* Z connects only to X.
* X connects to Y and U.
* Y connects to U.
* U connects to Y.
### Key Observations
* The graph is directed, meaning the relationships between nodes are one-way.
* Node Z is the only node with only an outgoing edge.
* Node U is the only node with both incoming and outgoing edges.
* There is a cycle between nodes Y and U.
### Interpretation
The diagram represents a system of relationships between four entities (X, Y, Z, and U). The arrows indicate the direction of influence or dependency. Node Z appears to be a source or input to node X. Nodes X and Y both influence node U, and there is a feedback loop between Y and U. The different colors of the arrows might indicate different types or strengths of relationships, but without further context, this is speculative. The diagram could represent a variety of systems, such as a causal network, a flow chart, or a dependency graph.