# Technical Data Extraction: Pairwise Comparisons Win Rate Chart
## 1. Document Overview
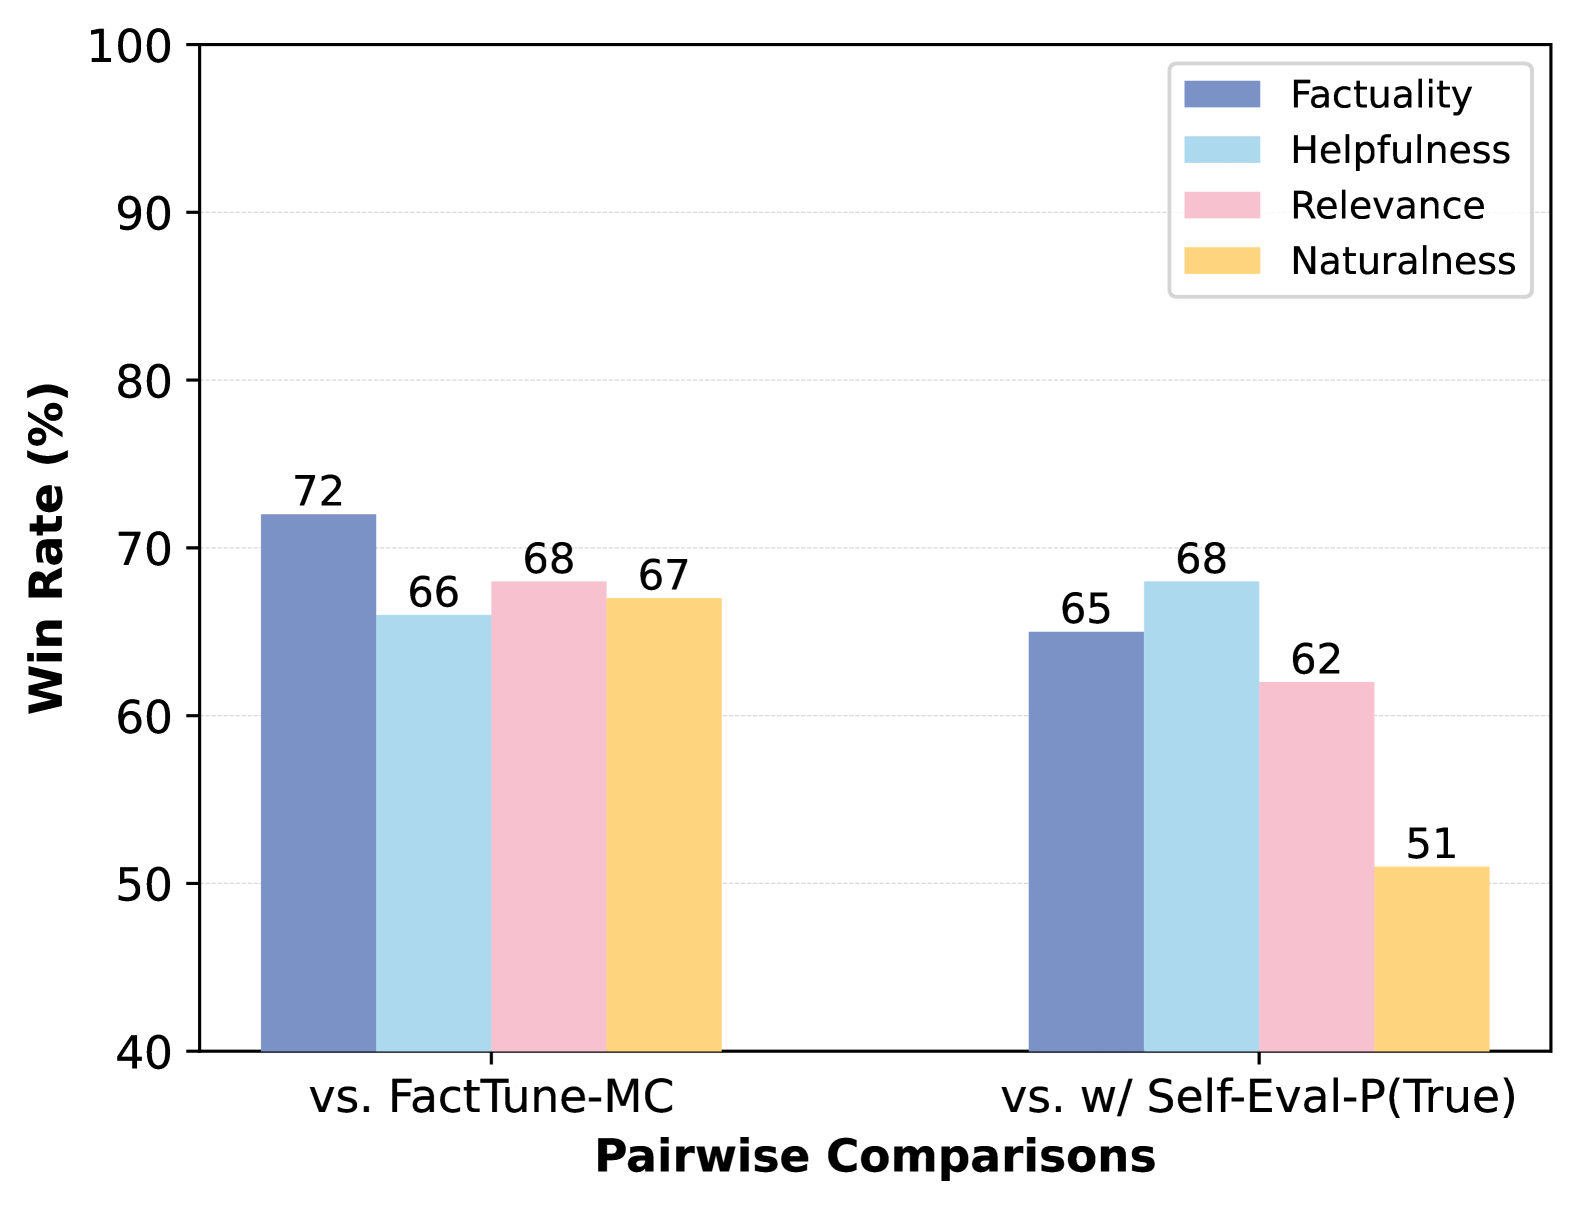
This image is a grouped bar chart illustrating the performance of a model across four distinct metrics during pairwise comparisons against two different baselines. The chart uses a color-coded system to differentiate between evaluation criteria.
## 2. Component Isolation
### A. Header/Legend
* **Location:** Top-right quadrant of the chart area.
* **Legend Items (Color-to-Label Mapping):**
* **Slate Blue:** Factuality
* **Light Blue:** Helpfulness
* **Pink:** Relevance
* **Yellow/Orange:** Naturalness
### B. Main Chart Area (Axes)
* **Y-Axis (Vertical):**
* **Title:** Win Rate (%)
* **Scale:** 40 to 100
* **Major Tick Marks:** 40, 50, 60, 70, 80, 90, 100
* **Gridlines:** Horizontal dashed lines at every 10-unit interval.
* **X-Axis (Horizontal):**
* **Title:** Pairwise Comparisons
* **Categories:**
1. vs. FactTune-MC
2. vs. w/ Self-Eval-P(True)
### C. Data Points (Bar Values)
Each bar is labeled with its specific numerical value at the top.
#### Category 1: vs. FactTune-MC
* **Factuality (Slate Blue):** 72
* **Helpfulness (Light Blue):** 66
* **Relevance (Pink):** 68
* **Naturalness (Yellow):** 67
#### Category 2: vs. w/ Self-Eval-P(True)
* **Factuality (Slate Blue):** 65
* **Helpfulness (Light Blue):** 68
* **Relevance (Pink):** 62
* **Naturalness (Yellow):** 51
---
## 3. Data Table Reconstruction
| Metric | vs. FactTune-MC (Win Rate %) | vs. w/ Self-Eval-P(True) (Win Rate %) |
| :--- | :---: | :---: |
| **Factuality** | 72 | 65 |
| **Helpfulness** | 66 | 68 |
| **Relevance** | 68 | 62 |
| **Naturalness** | 67 | 51 |
---
## 4. Trend Analysis and Observations
### Trend Verification
* **Factuality:** Shows a downward trend between the two comparisons, dropping from the highest overall value (72) to 65.
* **Helpfulness:** Shows a slight upward trend, increasing from 66 to 68. This is the only metric that improves in the second comparison.
* **Relevance:** Shows a downward trend, decreasing from 68 to 62.
* **Naturalness:** Shows a significant downward trend, dropping sharply from 67 to 51.
### Key Findings
1. **Dominant Metric:** "Factuality" is the strongest performing metric when compared against "FactTune-MC" (72%).
2. **Weakest Metric:** "Naturalness" is the lowest performing metric overall, specifically in the "vs. w/ Self-Eval-P(True)" comparison, where it barely maintains a majority win rate at 51%.
3. **Comparative Difficulty:** The baseline "w/ Self-Eval-P(True)" appears to be a more challenging opponent for the model in terms of Factuality, Relevance, and Naturalness, as the win rates are lower across those three categories compared to the "FactTune-MC" baseline.
4. **Consistency:** All win rates across all categories remain above 50%, indicating the primary model won more often than both baselines in every measured metric.