## Line Graph: Rouge-L Performance Comparison
### Overview
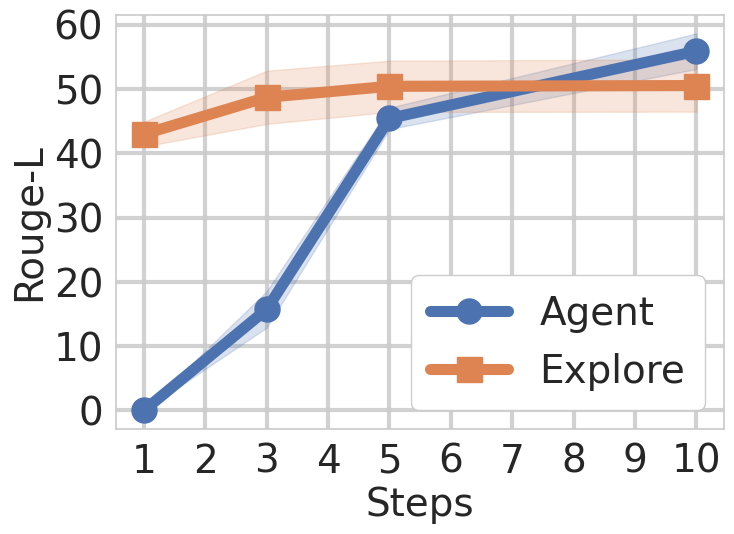
The image displays a line graph comparing the performance of two entities ("Agent" and "Explore") across 10 steps, measured by the metric "Rouge-L". The graph includes shaded confidence intervals around each line, indicating variability in measurements.
### Components/Axes
- **X-axis (Steps)**: Labeled "Steps", with integer markers from 1 to 10.
- **Y-axis (Rouge-L)**: Labeled "Rouge-L", with a scale from 0 to 60 in increments of 10.
- **Legend**: Located in the bottom-right corner, with:
- **Blue line with circles**: Labeled "Agent"
- **Orange line with squares**: Labeled "Explore"
- **Shaded Regions**: Light blue (Agent) and light orange (Explore) bands around the lines, representing confidence intervals.
### Detailed Analysis
#### Agent (Blue Line)
- **Step 1**: ~0
- **Step 3**: ~15
- **Step 5**: ~45
- **Step 10**: ~55
- **Trend**: Sharp upward trajectory after Step 3, with a plateau near 55 by Step 10. Confidence interval widens significantly after Step 5.
#### Explore (Orange Line)
- **Step 1**: ~40
- **Step 3**: ~48
- **Step 5**: ~50
- **Step 10**: ~50
- **Trend**: Gradual increase until Step 5, followed by a plateau. Confidence interval remains relatively narrow throughout.
### Key Observations
1. **Agent's Acceleration**: The Agent's performance surges after Step 5, surpassing Explore by Step 10.
2. **Explore's Stability**: Explore's performance plateaus at ~50 after Step 5, showing minimal improvement.
3. **Confidence Intervals**: Agent's uncertainty (shaded blue) increases markedly after Step 5, while Explore's remains consistent.
### Interpretation
The data suggests that the Agent's strategy becomes more effective over time, particularly after Step 5, where its performance overtakes Explore. The initial lower performance of the Agent (Step 1–3) may reflect an exploration or adaptation phase. In contrast, Explore's plateau indicates diminishing returns or a lack of adaptability in later steps. The widening confidence interval for the Agent implies increasing variability in its performance as steps progress, potentially due to complex decision-making or environmental changes. This graph highlights the importance of dynamic optimization in achieving superior long-term outcomes compared to static strategies.