## Line Charts: Validation Loss vs. Visual Encoder Size for Different LLMs
### Overview
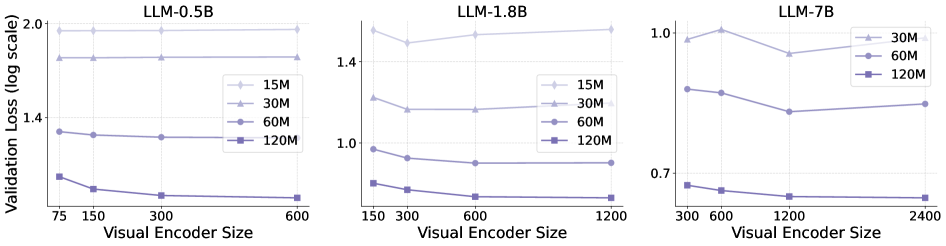
The image presents three line charts comparing the validation loss (on a logarithmic scale) against the visual encoder size for different Large Language Models (LLMs): LLM-0.5B, LLM-1.8B, and LLM-7B. Each chart displays the performance of the LLM with varying training data sizes (15M, 30M, 60M, and 120M).
### Components/Axes
* **Title:** Each chart has a title indicating the LLM being evaluated (LLM-0.5B, LLM-1.8B, LLM-7B).
* **X-axis:** "Visual Encoder Size" with different scales for each chart.
* LLM-0.5B: 75, 150, 300, 600
* LLM-1.8B: 150, 300, 600, 1200
* LLM-7B: 300, 600, 1200, 2400
* **Y-axis:** "Validation Loss (log scale)"
* LLM-0.5B: Scale from 1.4 to 2.0
* LLM-1.8B: Scale from 0.7 to 1.6
* LLM-7B: Scale from 0.6 to 1.0
* **Legend:** Located within each chart, indicating the training data size:
* 15M (lightest color, diamond marker)
* 30M (slightly darker, triangle marker)
* 60M (medium color, circle marker)
* 120M (darkest color, square marker)
### Detailed Analysis
**LLM-0.5B**
* **15M (lightest color, diamond marker):** The line is approximately flat at a validation loss of around 1.95 across all visual encoder sizes.
* **30M (slightly darker, triangle marker):** The line is approximately flat at a validation loss of around 1.7 across all visual encoder sizes.
* **60M (medium color, circle marker):** The line slightly decreases from approximately 1.5 to 1.4 as the visual encoder size increases from 75 to 600.
* **120M (darkest color, square marker):** The line decreases from approximately 1.2 to 1.1 as the visual encoder size increases from 75 to 600.
**LLM-1.8B**
* **15M (lightest color, diamond marker):** The line is approximately flat at a validation loss of around 1.5 across all visual encoder sizes.
* **30M (slightly darker, triangle marker):** The line is approximately flat at a validation loss of around 1.2 across all visual encoder sizes.
* **60M (medium color, circle marker):** The line decreases from approximately 0.95 to 0.85 as the visual encoder size increases from 150 to 1200.
* **120M (darkest color, square marker):** The line decreases from approximately 0.75 to 0.7 as the visual encoder size increases from 150 to 1200.
**LLM-7B**
* **30M (slightly darker, triangle marker):** The line decreases from approximately 1.0 to 0.9, then increases slightly to 0.92 as the visual encoder size increases from 300 to 2400.
* **60M (medium color, circle marker):** The line decreases from approximately 0.85 to 0.75, then increases slightly to 0.78 as the visual encoder size increases from 300 to 2400.
* **120M (darkest color, square marker):** The line decreases from approximately 0.68 to 0.63, then remains relatively flat as the visual encoder size increases from 300 to 2400.
### Key Observations
* For all LLMs, increasing the training data size (from 15M to 120M) generally reduces the validation loss, indicating better model performance.
* The validation loss tends to decrease as the visual encoder size increases, especially for the 60M and 120M training data sizes.
* The LLM-7B model shows a slight increase in validation loss at the largest visual encoder size (2400) for the 30M and 60M training data sizes.
### Interpretation
The data suggests that increasing both the training data size and the visual encoder size generally improves the performance of the LLMs, as indicated by the lower validation loss. The LLM-7B model, being the largest, benefits the most from increased training data and visual encoder size, achieving the lowest validation loss among the three models. The slight increase in validation loss for LLM-7B at the largest visual encoder size with smaller training datasets (30M and 60M) might indicate overfitting or the need for more data to fully utilize the larger encoder size.