\n
## Chart: Voltage vs. Time
### Overview
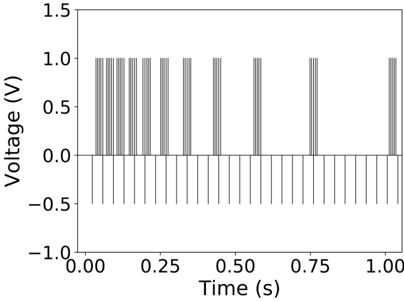
The image presents a time-domain plot of voltage, displaying a pulsed waveform. The waveform alternates between positive and negative voltage levels, creating a rectangular wave pattern. The plot spans a time duration of 1 second, with voltage ranging from -1.0 V to 1.5 V.
### Components/Axes
* **X-axis:** Time (s), ranging from 0.00 to 1.00, with markings at 0.25, 0.50, 0.75.
* **Y-axis:** Voltage (V), ranging from -1.0 to 1.5, with markings at -0.5, 0.0, 0.5, 1.0.
* **Data Series:** A single data series representing the voltage waveform.
### Detailed Analysis
The waveform consists of alternating positive and negative pulses.
* **Initial Pulse Train (0.00s - 0.25s):** A series of closely spaced positive pulses, each reaching approximately 1.0 V, followed by brief periods near 0 V. The pulses are very frequent, appearing almost continuous.
* **Pulse Train (0.25s - 0.50s):** A series of closely spaced positive pulses, each reaching approximately 1.0 V, followed by brief periods near 0 V. The pulses are very frequent, appearing almost continuous.
* **Single Pulse (0.50s - 0.60s):** A single, wider positive pulse reaching approximately 1.0 V.
* **Negative Pulse (0.60s - 0.75s):** A single, wider negative pulse reaching approximately -0.5 V.
* **Pulse Train (0.75s - 1.00s):** A series of closely spaced positive pulses, each reaching approximately 1.0 V, followed by brief periods near 0 V. The pulses are very frequent, appearing almost continuous.
The waveform spends a significant amount of time at or near 0 V between the pulses. The pulses are not perfectly symmetrical; the positive pulses appear slightly narrower than the negative pulse.
### Key Observations
* The waveform is primarily composed of rectangular pulses.
* The pulse frequency varies throughout the 1-second duration.
* There is a clear alternation between positive and negative voltage levels.
* The amplitude of the positive pulses is approximately 1.0 V, while the amplitude of the negative pulse is approximately -0.5 V.
### Interpretation
The data suggests a pulsed signal, potentially representing a digital signal or a modulated waveform. The varying pulse frequency could indicate a changing data rate or a more complex modulation scheme. The asymmetry in pulse width and amplitude might be due to circuit limitations or intentional design choices. The waveform could represent a signal being transmitted, a control signal for a device, or the output of a digital circuit. The presence of both positive and negative pulses suggests a bipolar signal representation. Without additional context, it's difficult to determine the exact purpose or origin of this waveform.