## Chart and Diagram: Rendering Speed vs. Distance and Trajectories
### Overview
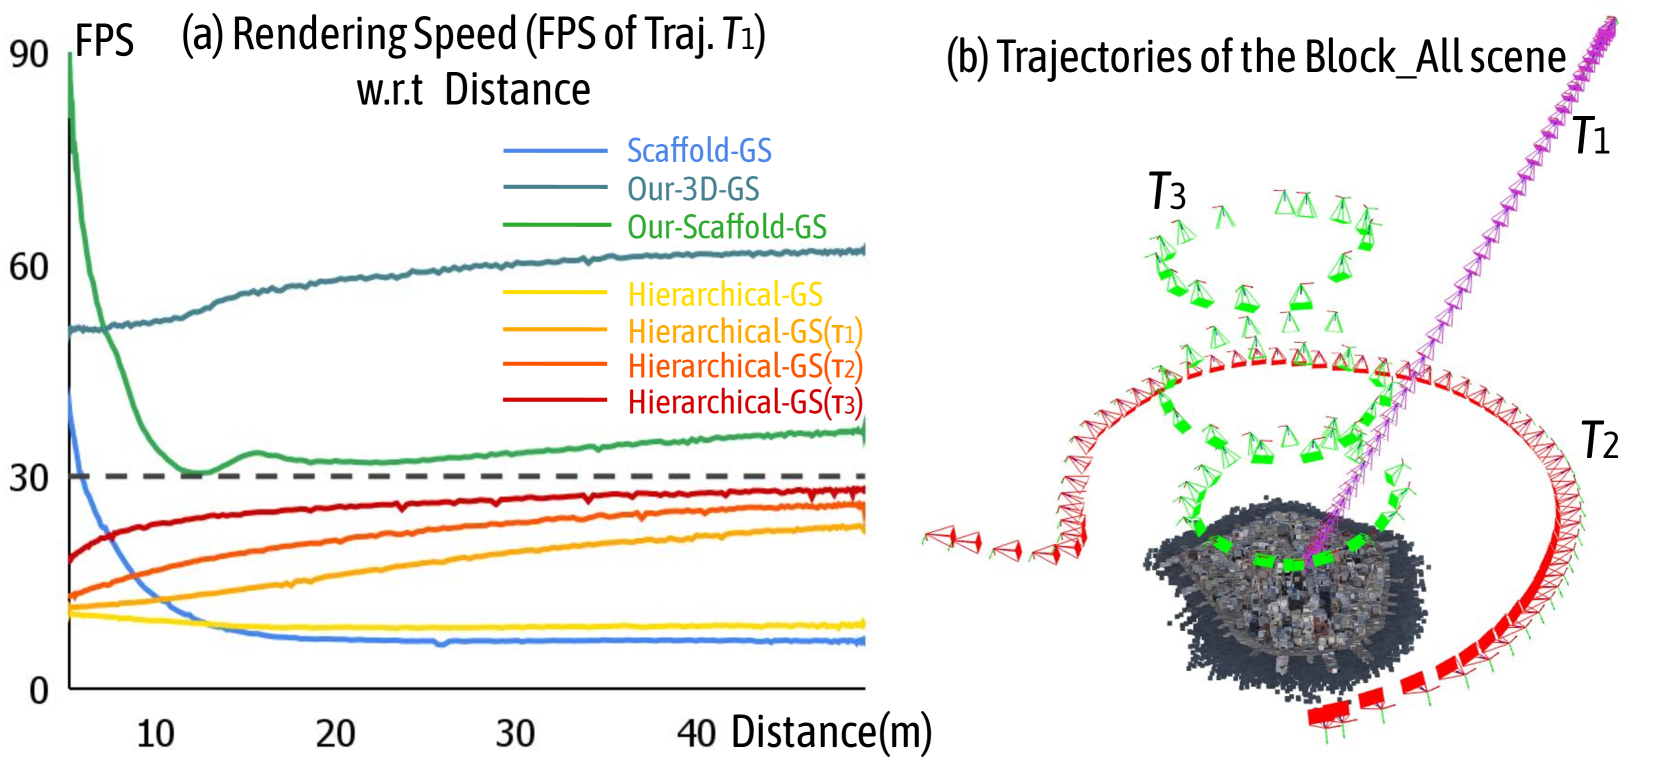
The image presents two sub-figures: (a) a line chart comparing the rendering speed (FPS) of different methods with respect to distance for trajectory T1, and (b) a diagram illustrating the trajectories of the Block_All scene.
### Components/Axes
**Sub-figure (a): Rendering Speed vs. Distance**
* **Title:** Rendering Speed (FPS of Traj. T1) w.r.t Distance
* **X-axis:** Distance (m), with markers at 10, 20, 30, and 40.
* **Y-axis:** FPS, with markers at 0, 30, 60, and 90.
* **Legend (Top-Right):**
* Blue: Scaffold-GS
* Dark Blue: Our-3D-GS
* Green: Our-Scaffold-GS
* Yellow: Hierarchical-GS
* Orange: Hierarchical-GS(T1)
* Red-Orange: Hierarchical-GS(T2)
* Red: Hierarchical-GS(T3)
* **Horizontal Line:** A dashed gray line is present at FPS = 30.
**Sub-figure (b): Trajectories of the Block_All scene**
* **Title:** Trajectories of the Block_All scene
* **Trajectories:** Three trajectories are shown, labeled T1, T2, and T3.
* T1: Purple
* T2: Red
* T3: Green
* **Scene Representation:** A cluster of dark gray points represents the "Block_All" scene.
* **Camera Icons:** Small camera icons are placed along each trajectory, indicating camera positions.
### Detailed Analysis
**Sub-figure (a): Rendering Speed vs. Distance**
* **Scaffold-GS (Blue):** Starts at approximately 30 FPS at a distance of 0m, decreases to approximately 5 FPS by 10m, and remains relatively constant at around 5 FPS from 10m to 40m.
* **Our-3D-GS (Dark Blue):** Starts at approximately 50 FPS at a distance of 0m, increases to approximately 60 FPS by 20m, and remains relatively constant at around 60 FPS from 20m to 40m.
* **Our-Scaffold-GS (Green):** Starts at approximately 90 FPS at a distance of 0m, decreases sharply to approximately 30 FPS by 10m, then increases slightly to approximately 35 FPS by 20m, and remains relatively constant at around 35 FPS from 20m to 40m.
* **Hierarchical-GS (Yellow):** Starts at approximately 15 FPS at a distance of 0m, decreases slightly to approximately 10 FPS by 10m, and remains relatively constant at around 10 FPS from 10m to 40m.
* **Hierarchical-GS(T1) (Orange):** Starts at approximately 15 FPS at a distance of 0m, increases to approximately 25 FPS by 40m.
* **Hierarchical-GS(T2) (Red-Orange):** Starts at approximately 20 FPS at a distance of 0m, increases to approximately 28 FPS by 40m.
* **Hierarchical-GS(T3) (Red):** Starts at approximately 25 FPS at a distance of 0m, increases to approximately 28 FPS by 40m.
**Sub-figure (b): Trajectories of the Block_All scene**
* **T1 (Purple):** A straight trajectory moving away from the scene.
* **T2 (Red):** A curved trajectory that loops around the scene.
* **T3 (Green):** A complex trajectory with multiple loops around the scene.
### Key Observations
* Our-3D-GS consistently maintains a high FPS compared to other methods across all distances.
* Scaffold-GS and Hierarchical-GS have the lowest FPS.
* The Hierarchical-GS variants (T1, T2, T3) show a gradual increase in FPS with distance.
* The trajectories in sub-figure (b) provide a visual representation of the camera movement around the Block_All scene.
### Interpretation
The data suggests that Our-3D-GS is the most efficient rendering method for the given scene and trajectory (T1), maintaining a consistently high frame rate as distance increases. Scaffold-GS and Hierarchical-GS are less efficient, with significantly lower frame rates. The trajectories in sub-figure (b) illustrate different camera paths around the scene, which may influence the rendering performance of the various methods. The horizontal line at 30 FPS likely represents a target or minimum acceptable frame rate for real-time rendering. The Hierarchical-GS variants show a slight improvement in FPS as distance increases, potentially due to optimizations related to level-of-detail or scene simplification at greater distances.