## Chart: Differentiable Parameter Learning with 1 label
### Overview
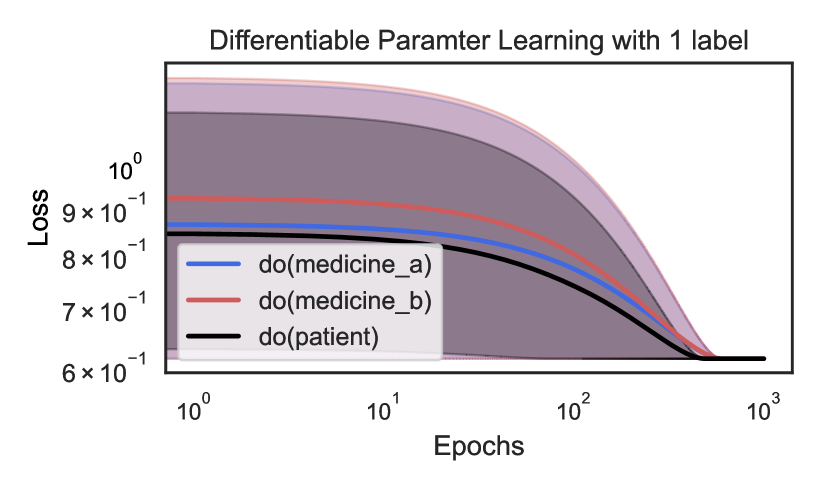
The image is a line chart showing the loss over epochs for three different conditions: "do(medicine_a)", "do(medicine_b)", and "do(patient)". The x-axis (Epochs) is on a logarithmic scale. Shaded regions around each line indicate uncertainty or variance.
### Components/Axes
* **Title:** Differentiable Parameter Learning with 1 label
* **X-axis:**
* Label: Epochs
* Scale: Logarithmic
* Markers: 10<sup>0</sup>, 10<sup>1</sup>, 10<sup>2</sup>, 10<sup>3</sup>
* **Y-axis:**
* Label: Loss
* Scale: Linear
* Markers: 6 x 10<sup>-1</sup>, 7 x 10<sup>-1</sup>, 8 x 10<sup>-1</sup>, 9 x 10<sup>-1</sup>, 10<sup>0</sup>
* **Legend:** Located in the center-left of the chart.
* Blue line: do(medicine\_a)
* Red line: do(medicine\_b)
* Black line: do(patient)
### Detailed Analysis
* **do(medicine\_a) (Blue):** The blue line starts at a loss of approximately 0.86 at epoch 1. It decreases slightly until around epoch 10, then decreases more rapidly until it plateaus at a loss of approximately 0.61 around epoch 100.
* **do(medicine\_b) (Red):** The red line starts at a loss of approximately 0.93 at epoch 1. It decreases gradually until around epoch 20, then decreases more rapidly until it plateaus at a loss of approximately 0.61 around epoch 100.
* **do(patient) (Black):** The black line starts at a loss of approximately 0.85 at epoch 1. It decreases more rapidly than the other two lines, reaching a loss of approximately 0.61 around epoch 50, and then remains relatively constant.
* **Shaded Regions:** Each line has a shaded region around it, indicating the variability or uncertainty in the loss. The shaded regions narrow as the number of epochs increases, suggesting that the model becomes more stable and consistent in its predictions.
### Key Observations
* All three conditions show a decrease in loss as the number of epochs increases, indicating that the model is learning.
* The "do(patient)" condition shows the fastest initial decrease in loss.
* All three conditions converge to a similar loss value (approximately 0.61) after a sufficient number of epochs.
* The uncertainty (shaded region) is highest at the beginning of training and decreases as training progresses.
### Interpretation
The chart demonstrates the learning curves for three different interventions or conditions. The "do(patient)" condition appears to be the most effective in reducing loss initially, suggesting that this intervention leads to faster learning. However, all three conditions eventually converge to a similar level of performance. The decreasing uncertainty over epochs indicates that the model becomes more reliable and consistent as it learns. The fact that all three converge to a similar loss value suggests that there may be a limit to how much the model can learn with the given data and architecture, or that the interventions have similar long-term effects.