## Chart: Plot of Delta-Bar vs. Eta for Different Delta Values
### Overview
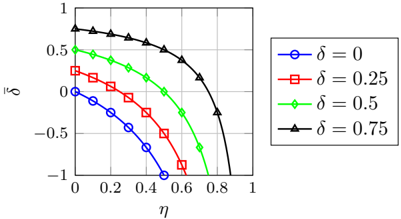
The image is a 2D plot showing the relationship between two variables, delta-bar (δ̄) on the y-axis and eta (η) on the x-axis, for four different values of delta (δ): 0, 0.25, 0.5, and 0.75. Each delta value is represented by a different colored line with a distinct marker.
### Components/Axes
* **X-axis:** η (eta), ranging from 0 to 1 in increments of 0.2.
* **Y-axis:** δ̄ (delta-bar), ranging from -1 to 1 in increments of 0.5.
* **Legend:** Located on the right side of the plot, it identifies each line by its color, marker, and corresponding delta value:
* Blue line with circle markers: δ = 0
* Red line with square markers: δ = 0.25
* Green line with diamond markers: δ = 0.5
* Black line with triangle markers: δ = 0.75
### Detailed Analysis
* **δ = 0 (Blue, Circles):** The line starts at approximately (0, 0) and decreases to approximately (0.6, -1).
* **δ = 0.25 (Red, Squares):** The line starts at approximately (0, 0.25) and decreases to approximately (0.7, -1).
* **δ = 0.5 (Green, Diamonds):** The line starts at approximately (0, 0.5) and decreases to approximately (0.8, -0.9).
* **δ = 0.75 (Black, Triangles):** The line starts at approximately (0, 0.75) and decreases to approximately (0.9, -0.9).
Here's a breakdown of approximate data points for each series:
* **δ = 0 (Blue, Circles):**
* (0, 0)
* (0.2, -0.25)
* (0.4, -0.6)
* (0.6, -1)
* **δ = 0.25 (Red, Squares):**
* (0, 0.25)
* (0.2, 0.1)
* (0.4, -0.25)
* (0.6, -0.9)
* **δ = 0.5 (Green, Diamonds):**
* (0, 0.5)
* (0.2, 0.45)
* (0.4, 0.2)
* (0.6, -0.5)
* (0.8, -0.9)
* **δ = 0.75 (Black, Triangles):**
* (0, 0.75)
* (0.2, 0.7)
* (0.4, 0.6)
* (0.6, 0.4)
* (0.8, 0)
* (0.9, -0.9)
### Key Observations
* As η increases, δ̄ generally decreases for all values of δ.
* For a given value of η, as δ increases, δ̄ also tends to increase.
* The curves become steeper as δ decreases.
### Interpretation
The plot illustrates the relationship between δ̄ and η for different values of δ. The data suggests that increasing δ shifts the curve upwards, indicating a positive correlation between δ and δ̄. The negative slope of each curve indicates an inverse relationship between η and δ̄. The varying steepness of the curves suggests that the sensitivity of δ̄ to changes in η depends on the value of δ.