\n
## Scatter Plot: Confidence vs. Target Length
### Overview
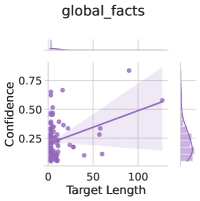
The image presents a scatter plot visualizing the relationship between "Target Length" and "Confidence". A regression line is overlaid on the scatter points, along with a shaded confidence interval around the line. The plot is titled "global_facts" at the top-center.
### Components/Axes
* **X-axis:** "Target Length" - Scale ranges from approximately 0 to 120.
* **Y-axis:** "Confidence" - Scale ranges from approximately 0.15 to 0.8.
* **Data Points:** Numerous purple circles representing individual data points.
* **Regression Line:** A purple line representing the trend of the data.
* **Confidence Interval:** A light purple shaded area around the regression line, indicating the uncertainty in the line's estimate.
* **Title:** "global_facts" - positioned at the top-center of the plot.
### Detailed Analysis
The scatter plot shows a generally positive correlation between "Target Length" and "Confidence". As "Target Length" increases, "Confidence" tends to increase as well, though with considerable scatter.
* **Trend of Regression Line:** The regression line slopes upward from left to right, confirming the positive correlation.
* **Data Point Distribution:**
* At "Target Length" values near 0, "Confidence" values range from approximately 0.15 to 0.7.
* As "Target Length" increases to around 50, "Confidence" values generally increase, ranging from approximately 0.2 to 0.6.
* Between "Target Length" values of 50 and 100, "Confidence" values continue to increase, ranging from approximately 0.3 to 0.6.
* At "Target Length" values around 100, "Confidence" values reach approximately 0.5 to 0.6.
* There is a single outlier data point at approximately "Target Length" = 75 and "Confidence" = 0.75.
* **Confidence Interval:** The confidence interval is wider at lower "Target Length" values and appears to narrow slightly as "Target Length" increases. This suggests greater uncertainty in the relationship at lower "Target Length" values.
### Key Observations
* The positive correlation between "Target Length" and "Confidence" is evident.
* The scatter is significant, indicating that "Target Length" is not the sole determinant of "Confidence".
* The confidence interval suggests that the relationship is more uncertain at lower "Target Length" values.
* The outlier data point at (75, 0.75) deviates from the general trend.
### Interpretation
The data suggests that as the "Target Length" increases, the "Confidence" in some associated process or prediction also tends to increase. This could represent a scenario where longer targets lead to more reliable results, or where more information is available for longer targets, leading to higher confidence. The scatter indicates that other factors also influence "Confidence", and the confidence interval highlights the uncertainty in the relationship, particularly for shorter "Target Length" values. The outlier may represent an unusual case or an error in the data. The title "global_facts" suggests this data relates to a broad set of facts or knowledge. The plot could be used to assess the reliability of predictions or the quality of information based on the length of the target being considered.