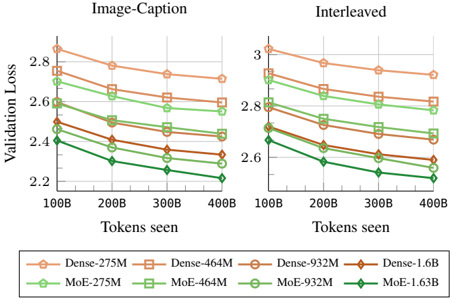
## Line Chart: Validation Loss vs. Tokens Seen (Image-Caption and Interleaved Tasks)
### Overview
The image is a dual-axis line chart comparing validation loss across different model sizes (Dense and Mixture-of-Experts [MoE]) for two tasks: "Image-Caption" (left) and "Interleaved" (right). The x-axis represents tokens seen (100B to 400B), and the y-axis represents validation loss (2.2 to 3.0). Each model is represented by a colored line with markers, and trends are consistent across both tasks.
---
### Components/Axes
- **X-Axis (Horizontal)**: "Tokens seen" (100B, 200B, 300B, 400B).
- **Y-Axis (Vertical)**: "Validation Loss" (2.2 to 3.0).
- **Legend (Bottom)**:
- **Dense Models**:
- Dense-275M (orange circles)
- Dense-464M (orange squares)
- Dense-932M (orange diamonds)
- Dense-1.6B (orange triangles)
- **MoE Models**:
- MoE-275M (green circles)
- MoE-464M (green squares)
- MoE-932M (green diamonds)
- MoE-1.63B (green triangles)
- **Sections**:
- Left: "Image-Caption" task.
- Right: "Interleaved" task.
---
### Detailed Analysis
#### Image-Caption Task (Left)
- **Dense Models**:
- **Dense-275M**: Starts at ~2.85 (100B tokens), decreases to ~2.65 (400B tokens).
- **Dense-464M**: Starts at ~2.75, decreases to ~2.55.
- **Dense-932M**: Starts at ~2.65, decreases to ~2.45.
- **Dense-1.6B**: Starts at ~2.55, decreases to ~2.35.
- **MoE Models**:
- **MoE-275M**: Starts at ~2.75, decreases to ~2.55.
- **MoE-464M**: Starts at ~2.65, decreases to ~2.45.
- **MoE-932M**: Starts at ~2.55, decreases to ~2.35.
- **MoE-1.63B**: Starts at ~2.45, decreases to ~2.25.
#### Interleaved Task (Right)
- **Dense Models**:
- **Dense-275M**: Starts at ~3.0, decreases to ~2.8.
- **Dense-464M**: Starts at ~2.9, decreases to ~2.7.
- **Dense-932M**: Starts at ~2.8, decreases to ~2.6.
- **Dense-1.6B**: Starts at ~2.7, decreases to ~2.5.
- **MoE Models**:
- **MoE-275M**: Starts at ~2.9, decreases to ~2.7.
- **MoE-464M**: Starts at ~2.8, decreases to ~2.6.
- **MoE-932M**: Starts at ~2.7, decreases to ~2.5.
- **MoE-1.63B**: Starts at ~2.6, decreases to ~2.4.
---
### Key Observations
1. **Consistent Trends**: All models show decreasing validation loss as tokens increase, indicating improved performance with more data.
2. **MoE Superiority**: MoE models consistently outperform Dense models in both tasks, with smaller validation loss gaps at higher token counts.
3. **Task-Specific Performance**:
- In "Image-Caption", MoE-1.63B achieves ~2.25 loss at 400B tokens.
- In "Interleaved", MoE-1.63B achieves ~2.4 loss at 400B tokens.
4. **Scalability**: Larger models (e.g., Dense-1.6B vs. MoE-1.63B) show diminishing returns, with smaller performance gains relative to their size.
---
### Interpretation
The data demonstrates that **MoE architectures are more efficient** than Dense models for both tasks, maintaining lower validation loss even as token counts scale. This suggests MoE's modular design (activating only relevant subnetworks) offers better resource utilization. The narrowing gap between Dense and MoE models at higher token counts implies that MoE's efficiency advantage persists despite increased data complexity. The "Interleaved" task's higher baseline loss for all models may reflect greater task complexity, but MoE still maintains a relative advantage. These findings align with prior research on MoE's scalability in large language models.