## Line Chart: DeepProbLog Loss Curve
### Overview
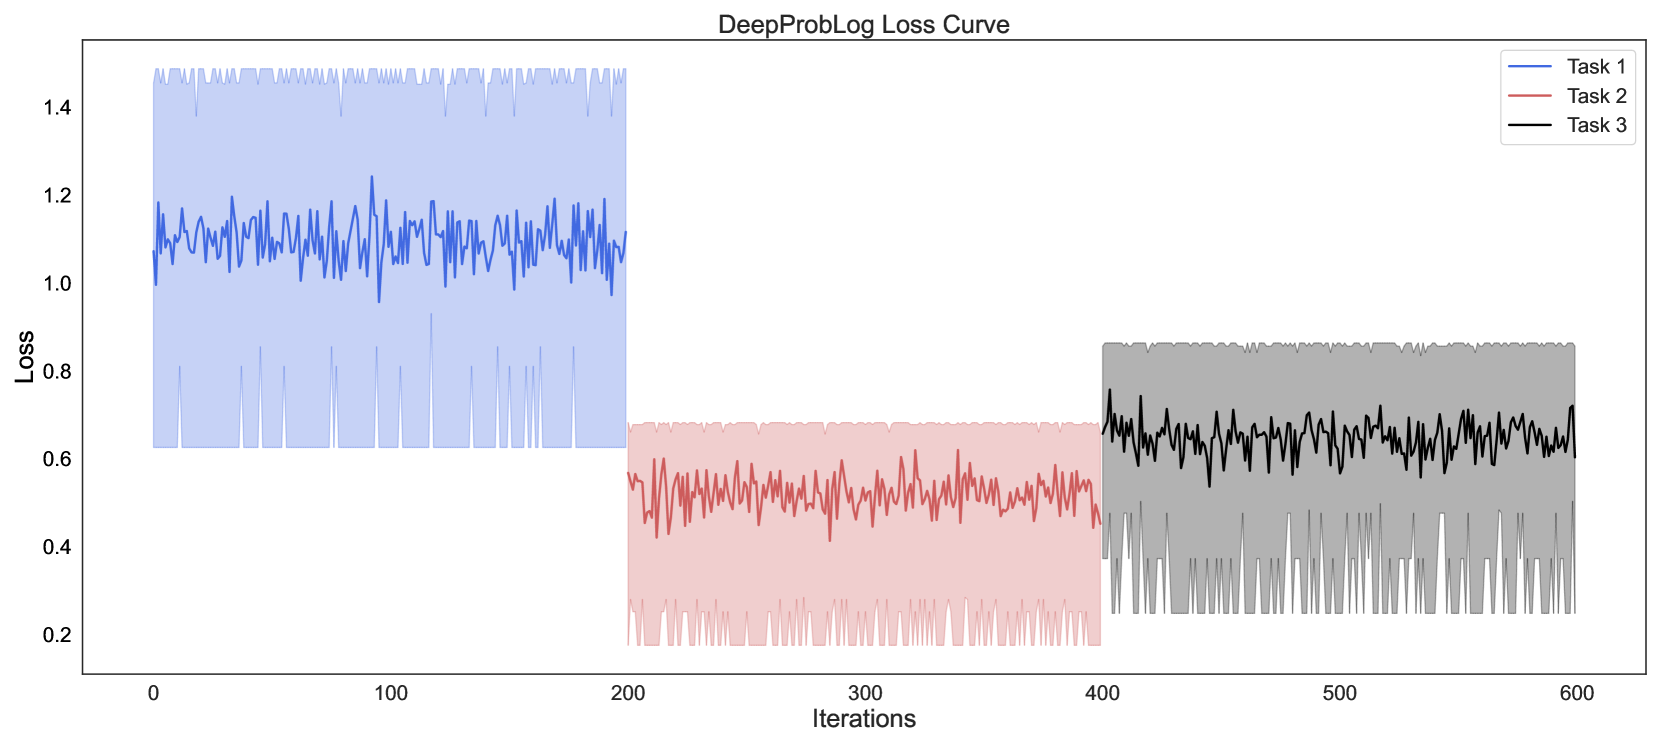
The chart displays three distinct loss curves for different tasks (Task 1, Task 2, Task 3) plotted against iterations (0–600). Each task is represented by a colored line with a shaded confidence interval. The y-axis measures loss values (0.2–1.4), while the x-axis tracks training iterations. The legend in the top-right corner maps colors to tasks.
### Components/Axes
- **X-axis (Iterations)**: Labeled "Iterations," spanning 0 to 600 in increments of 100.
- **Y-axis (Loss)**: Labeled "LOSS," ranging from 0.2 to 1.4.
- **Legend**: Positioned in the top-right corner, with:
- **Blue line**: Task 1
- **Red line**: Task 2
- **Black line**: Task 3
- **Shaded Areas**: Light-colored bands around each line, likely representing confidence intervals or error margins.
### Detailed Analysis
1. **Task 1 (Blue)**:
- **Placement**: Leftmost segment (0–200 iterations).
- **Trend**: Starts at ~1.3 loss, fluctuates between 1.0–1.4, with sharp peaks and troughs.
- **Shaded Area**: Light blue band shows variability, peaking at ~1.4 and dipping to ~0.8.
2. **Task 2 (Red)**:
- **Placement**: Middle segment (200–400 iterations).
- **Trend**: Starts at ~0.6 loss, stabilizes between 0.4–0.6 with smaller oscillations.
- **Shaded Area**: Light red band indicates tighter confidence intervals compared to Task 1.
3. **Task 3 (Black)**:
- **Placement**: Rightmost segment (400–600 iterations).
- **Trend**: Starts at ~0.8 loss, fluctuates between 0.6–0.8 with moderate variability.
- **Shaded Area**: Light gray band shows wider variability than Task 2 but less than Task 1.
### Key Observations
- **Task 1** exhibits the highest initial loss and greatest variability, suggesting it is the most challenging task.
- **Task 2** stabilizes quickly, with the lowest loss range (0.4–0.6) and narrowest confidence intervals.
- **Task 3** has intermediate loss values (0.6–0.8) and moderate variability, indicating it is less stable than Task 2 but more so than Task 1.
- All tasks show diminishing oscillations over time, implying convergence toward stable loss values.
### Interpretation
The data suggests a hierarchical difficulty in tasks: Task 1 is the most complex, requiring the most iterations to stabilize, while Task 2 converges fastest. The shaded areas highlight uncertainty in Task 1’s predictions, possibly due to higher model sensitivity or data complexity. Task 3’s intermediate performance may reflect a balance between complexity and model adaptability. The separation of tasks into distinct time windows (0–200, 200–400, 400–600) could indicate phased training or task-specific optimization strategies.