\n
## Diagram: State Transition Diagram
### Overview
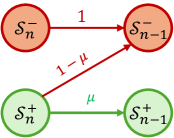
The image depicts a state transition diagram with four states represented by colored circles and transitions between them indicated by arrows labeled with probabilities. The diagram appears to model a stochastic process with two possible states, positive (+) and negative (-), at different time steps 'n' and 'n-1'.
### Components/Axes
The diagram consists of the following components:
* **States:**
* S<sub>n</sub><sup>-</sup> (Top-left, Red circle)
* S<sub>n-1</sub><sup>-</sup> (Top-right, Red circle)
* S<sub>n</sub><sup>+</sup> (Bottom-left, Green circle)
* S<sub>n-1</sub><sup>+</sup> (Bottom-right, Green circle)
* **Transitions:**
* From S<sub>n</sub><sup>-</sup> to S<sub>n-1</sub><sup>-</sup>: Labeled "1", Red arrow.
* From S<sub>n</sub><sup>-</sup> to S<sub>n-1</sub><sup>+</sup>: Labeled "1 - μ", Red arrow.
* From S<sub>n</sub><sup>+</sup> to S<sub>n-1</sub><sup>+</sup>: Labeled "μ", Green arrow.
### Detailed Analysis or Content Details
The diagram shows transitions between states at time 'n' and 'n-1'. The probabilities associated with these transitions are:
* **S<sub>n</sub><sup>-</sup> to S<sub>n-1</sub><sup>-</sup>:** Probability = 1. This indicates a certain transition.
* **S<sub>n</sub><sup>-</sup> to S<sub>n-1</sub><sup>+</sup>:** Probability = 1 - μ. This represents the probability of transitioning from the negative state at time 'n' to the positive state at time 'n-1'.
* **S<sub>n</sub><sup>+</sup> to S<sub>n-1</sub><sup>+</sup>:** Probability = μ. This represents the probability of remaining in the positive state from time 'n' to 'n-1'.
There is no explicit indication of a transition from S<sub>n</sub><sup>+</sup> to S<sub>n-1</sub><sup>-</sup>.
### Key Observations
The diagram suggests a Markov process where the future state depends only on the current state. The parameter μ likely represents the probability of staying in the positive state. The transitions are directed, indicating a temporal aspect to the process. The probabilities associated with the transitions sum to 1 for each state, ensuring that the system remains within the defined states.
### Interpretation
This diagram likely represents a simplified model of a system that can exist in two states (positive and negative) and transitions between them with certain probabilities. The parameter μ controls the tendency of the system to remain in the positive state. This type of diagram is commonly used in fields like stochastic modeling, queuing theory, or hidden Markov models. The absence of a transition from S<sub>n</sub><sup>+</sup> to S<sub>n-1</sub><sup>-</sup> could indicate a constraint or assumption within the model. The diagram could be used to analyze the long-term behavior of the system, such as the probability of being in a particular state after a certain number of time steps. The use of red and green colors may be intended to visually represent negative and positive states, respectively. The diagram is a visual representation of a probabilistic process, and the values of μ would determine the specific behavior of the system.