\n
## State Transition Diagram: Two-State System with Probabilistic Transitions
### Overview
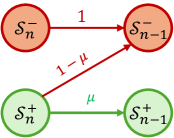
The image displays a directed graph diagram representing a state transition model, likely a Markov chain or similar stochastic process. It consists of four nodes arranged in a 2x2 grid, connected by three directed edges (arrows) with associated transition probabilities or rates. The diagram uses color-coding (red and green) and mathematical notation to define states and their relationships.
### Components/Axes
**Nodes (States):**
* **Top-Left Node:** A red circle labeled `S_n^-`.
* **Top-Right Node:** A red circle labeled `S_{n-1}^-`.
* **Bottom-Left Node:** A green circle labeled `S_n^+`.
* **Bottom-Right Node:** A green circle labeled `S_{n+1}^+`.
**Edges (Transitions):**
1. A horizontal red arrow from `S_n^-` (top-left) to `S_{n-1}^-` (top-right). It is labeled with the number `1`.
2. A diagonal red arrow from `S_n^+` (bottom-left) to `S_{n-1}^-` (top-right). It is labeled with the expression `1 - μ`.
3. A horizontal green arrow from `S_n^+` (bottom-left) to `S_{n+1}^+` (bottom-right). It is labeled with the Greek letter `μ` (mu).
**Spatial Layout:**
* The diagram is organized into two distinct rows.
* The **top row** contains the two red nodes (`S_n^-` and `S_{n-1}^-`), connected by a direct horizontal transition.
* The **bottom row** contains the two green nodes (`S_n^+` and `S_{n+1}^+`), connected by a direct horizontal transition.
* The **diagonal transition** connects the bottom-left green node (`S_n^+`) to the top-right red node (`S_{n-1}^-`), crossing from the lower to the upper row.
### Detailed Analysis
**State Notation:**
* The states are denoted by `S` with a subscript (`n`, `n-1`, `n+1`) and a superscript (`+` or `-`).
* The subscript likely represents a discrete index, such as time step, generation, or a counter.
* The superscript (`+`/`-`) denotes a binary attribute or category, visually reinforced by the green/red color coding.
**Transition Logic:**
* From state `S_n^-` (red, index `n`), there is a **certain transition** (probability/rate = `1`) to state `S_{n-1}^-` (red, index `n-1`). This represents a deterministic decrease in the index while staying in the "negative" (`-`) category.
* From state `S_n^+` (green, index `n`), there are two possible transitions:
1. To state `S_{n-1}^-` (red, index `n-1`) with a weight of `1 - μ`. This represents a change from the "positive" (`+`) to the "negative" (`-`) category, accompanied by a decrease in index.
2. To state `S_{n+1}^+` (green, index `n+1`) with a weight of `μ`. This represents staying in the "positive" (`+`) category while increasing the index.
* The sum of the weights for transitions originating from `S_n^+` is `(1 - μ) + μ = 1`, indicating these are complementary probabilities.
### Key Observations
1. **Asymmetric Connectivity:** The "negative" (`-`) states only have outgoing transitions to other "negative" states (specifically, decreasing the index). The "positive" (`+`) state `S_n^+` is the only node with branching transitions, leading to both a "negative" state and another "positive" state.
2. **Index Flow:** The index (`n`) can decrease (`n -> n-1`), increase (`n -> n+1`), or stay conceptually similar (the transition from `S_n^-` to `S_{n-1}^-` changes the index but maintains the `-` category).
3. **Color-Coded Categories:** The red/green dichotomy is consistent. All nodes with a `-` superscript are red. All nodes with a `+` superscript are green. The diagonal transition arrow is also red, matching its destination node's color (`S_{n-1}^-`).
4. **Parameter `μ`:** The Greek letter `μ` acts as a critical parameter controlling the fate of the system when in the `S_n^+` state. It determines the probability of remaining in the "positive" lineage versus defecting to the "negative" lineage.
### Interpretation
This diagram models a **two-type branching process or a state-dependent random walk**. The states likely represent populations, strategies, or conditions in a system (e.g., in evolutionary game theory, population genetics, or stochastic modeling).
* **The "Negative" (`-`) Lineage:** Appears to be a **declining or absorbing pathway**. Once in a `-` state, the system deterministically moves to a `-` state with a lower index (`n-1`), suggesting a countdown or a process that terminates or reduces a count.
* **The "Positive" (`+`) Lineage:** Represents a **growth or persistence pathway**. From `S_n^+`, there's a probability `μ` to advance to a higher index (`S_{n+1}^+`), indicating growth, reproduction, or success. However, there's a risk (`1 - μ`) of "failure" or "mutation," where the system transitions to the declining `-` lineage at a lower index (`S_{n-1}^-`).
* **System Dynamics:** The overall behavior hinges on the value of `μ`. A high `μ` favors the expansion of the `+` lineage. A low `μ` leads to frequent collapse into the `-` lineage, which then deterministically winds down. The diagram captures a fundamental tension between growth and decay, persistence and failure, governed by a single parameter. The absence of transitions *into* the `S_n^-` state from any other state except `S_n^+` suggests it might be a specific entry point into the declining pathway.