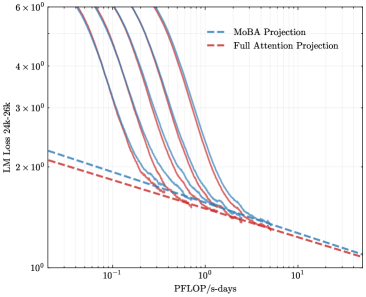
## Line Graph: LM Loss vs. PFLOP/s-days Projections
### Overview
The image is a logarithmic line graph comparing two computational efficiency projections: "MoBA Projection" (blue dashed line) and "Full Attention Projection" (red dashed line). The y-axis represents "LM Loss 24k-26k" (likely language model loss metrics), while the x-axis represents "PFLOP/s-days" (petaflops per second-days, a measure of computational budget). Both axes use logarithmic scaling, with the y-axis ranging from 10⁰ to 6×10⁰ and the x-axis from 10⁻¹ to 10¹.
### Components/Axes
- **Y-Axis (Left)**: Labeled "LM Loss 24k-26k" with tick marks at 10⁰, 2×10⁰, 3×10⁰, 4×10⁰, 5×10⁰, and 6×10⁰. Values are plotted on a logarithmic scale.
- **X-Axis (Bottom)**: Labeled "PFLOP/s-days" with tick marks at 10⁻¹, 10⁰, and 10¹. Values are plotted on a logarithmic scale.
- **Legend (Right)**:
- Blue dashed line: "MoBA Projection"
- Red dashed line: "Full Attention Projection"
### Detailed Analysis
- **MoBA Projection (Blue Dashed Line)**:
- Starts at approximately 2.5×10⁰ LM Loss at 10⁻¹ PFLOP/s-days.
- Slopes downward steeply, reaching ~1.2×10⁰ LM Loss at 10¹ PFLOP/s-days.
- Maintains a consistent downward trend with minimal curvature.
- **Full Attention Projection (Red Dashed Line)**:
- Begins slightly lower than MoBA at 10⁻¹ PFLOP/s-days (~2.2×10⁰ LM Loss).
- Follows a similar downward trajectory but with slightly more curvature.
- Converges with the MoBA line near 10¹ PFLOP/s-days, ending at ~1.1×10⁰ LM Loss.
### Key Observations
1. Both projections show a strong negative correlation between computational budget (PFLOP/s-days) and LM Loss, indicating improved efficiency with increased resources.
2. The MoBA Projection consistently outperforms the Full Attention Projection across all x-axis values, maintaining a ~10–20% lower LM Loss.
3. The lines converge at higher computational budgets (10¹ PFLOP/s-days), suggesting diminishing returns for both approaches at extreme scales.
### Interpretation
The graph demonstrates that the MoBA Projection achieves superior language model performance (lower loss) compared to the Full Attention Projection for equivalent computational budgets. This implies MoBA may offer architectural or algorithmic advantages in resource efficiency. The convergence at 10¹ PFLOP/s-days hints that both methods plateau in gains beyond this threshold, though MoBA retains a marginal edge. These trends could inform decisions in large-scale model training, where optimizing computational efficiency is critical.