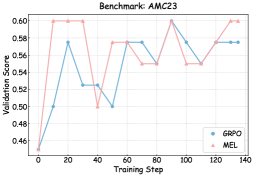
## Line Chart: Benchmark AMC23 Validation Scores
### Overview
The image is a line chart comparing the validation scores of two methods, **GRPO** (blue) and **MEL** (red), across 140 training steps on the AMC23 benchmark. The y-axis represents validation scores (0.46–0.60), and the x-axis represents training steps (0–140). Both lines exhibit fluctuating trends with peaks and troughs, converging at later steps.
---
### Components/Axes
- **X-axis (Training Step)**: Labeled "Training Step," ranging from 0 to 140 in increments of 20.
- **Y-axis (Validation Score)**: Labeled "Validation Score," ranging from 0.46 to 0.60 in increments of 0.02.
- **Legend**: Located in the **bottom-right corner**, with:
- **Blue circles**: GRPO
- **Red triangles**: MEL
---
### Detailed Analysis
#### GRPO (Blue Line)
- **Initial Phase (0–20 steps)**: Starts at ~0.46, rises sharply to ~0.58 by step 20.
- **Mid-Phase (20–80 steps)**: Drops to ~0.52 at step 40, rises to ~0.58 at step 60, then dips to ~0.54 at step 80.
- **Late Phase (80–140 steps)**: Peaks at ~0.60 at step 100, stabilizes around ~0.58 by step 140.
#### MEL (Red Line)
- **Initial Phase (0–20 steps)**: Starts at ~0.46, rises sharply to ~0.60 by step 20.
- **Mid-Phase (20–80 steps)**: Drops to ~0.50 at step 40, rises to ~0.58 at step 60, dips to ~0.54 at step 80.
- **Late Phase (80–140 steps)**: Peaks at ~0.60 at step 100, stabilizes around ~0.58 by step 140.
---
### Key Observations
1. **Initial Divergence**: Both methods start similarly but diverge sharply after step 20, with MEL achieving a higher peak (~0.60) earlier.
2. **Volatility**: GRPO exhibits more frequent fluctuations (e.g., step 40–60), while MEL has sharper drops (e.g., step 20–40).
3. **Convergence**: Both lines stabilize near ~0.58 by step 140, suggesting similar long-term performance.
4. **Outliers**:
- GRPO’s peak at step 100 (~0.60) is the highest validation score.
- MEL’s drop to ~0.50 at step 40 is the lowest point for either method.
---
### Interpretation
The chart demonstrates that both GRPO and MEL improve validation scores over training steps, but with distinct patterns:
- **GRPO** shows gradual, sustained improvement with moderate volatility, peaking at step 100.
- **MEL** achieves higher early gains but experiences sharper declines, stabilizing later.
- The convergence at step 140 implies that extended training mitigates initial disparities, though GRPO’s trajectory suggests better consistency in later stages.
This analysis highlights trade-offs between early performance (MEL) and long-term stability (GRPO) in the AMC23 benchmark.