## Chart: Timesteps per Episode vs. Training Timesteps
### Overview
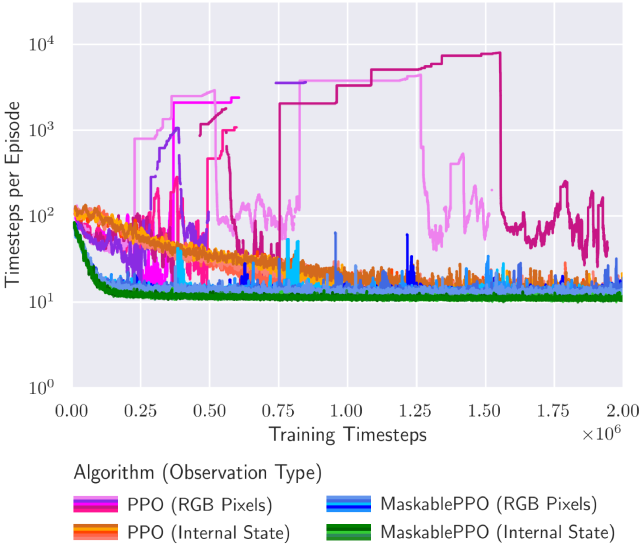
The image is a line graph comparing the performance of different reinforcement learning algorithms (PPO and MaskablePPO) using different observation types (RGB Pixels and Internal State). The graph plots "Timesteps per Episode" on a logarithmic scale against "Training Timesteps" on a linear scale.
### Components/Axes
* **Title:** None
* **X-axis:**
* Label: "Training Timesteps"
* Scale: Linear, from 0.00 to 2.00, with increments of 0.25. Multiplied by 10^6.
* Markers: 0.00, 0.25, 0.50, 0.75, 1.00, 1.25, 1.50, 1.75, 2.00
* **Y-axis:**
* Label: "Timesteps per Episode"
* Scale: Logarithmic (base 10), from 10^0 to 10^4
* Markers: 10^0, 10^1, 10^2, 10^3, 10^4
* **Legend:** Located at the bottom of the chart.
* **Magenta:** PPO (RGB Pixels)
* **Orange:** PPO (Internal State)
* **Blue:** MaskablePPO (RGB Pixels)
* **Green:** MaskablePPO (Internal State)
### Detailed Analysis
* **Magenta Line: PPO (RGB Pixels)**
* Trend: Initially increases rapidly, reaching approximately 10^3 timesteps per episode around 0.5 x 10^6 training timesteps. It then fluctuates significantly, with some drops and rises, before stabilizing around 10^2 timesteps per episode after 1.5 x 10^6 training timesteps.
* Data Points: Starts around 10^1, peaks around 10^3, stabilizes around 10^2.
* **Orange Line: PPO (Internal State)**
* Trend: Starts high, around 10^2 timesteps per episode, and decreases slightly before fluctuating around 10^1 to 10^2 timesteps per episode throughout the training process.
* Data Points: Starts around 10^2, fluctuates between 10^1 and 10^2.
* **Blue Line: MaskablePPO (RGB Pixels)**
* Trend: Starts around 10^2 timesteps per episode, decreases slightly, and then fluctuates around 10^1 timesteps per episode throughout the training process. There are some spikes to higher values.
* Data Points: Starts around 10^2, fluctuates around 10^1.
* **Green Line: MaskablePPO (Internal State)**
* Trend: Starts around 10^2 timesteps per episode, decreases rapidly to around 10^1 timesteps per episode, and remains relatively stable at that level throughout the training process.
* Data Points: Starts around 10^2, stabilizes around 10^1.
### Key Observations
* PPO (RGB Pixels) shows the most significant initial improvement but also the most instability.
* MaskablePPO (Internal State) converges quickly to a stable, low number of timesteps per episode.
* Using Internal State generally results in lower timesteps per episode compared to using RGB Pixels.
* MaskablePPO algorithms appear more stable than PPO algorithms.
### Interpretation
The graph illustrates the learning curves of different reinforcement learning algorithms under different observation conditions. The PPO algorithm, when using RGB pixels as input, initially learns faster but exhibits more instability during training. The MaskablePPO algorithm, especially when using the internal state, demonstrates more stable learning and converges to a lower number of timesteps per episode, suggesting more efficient learning. The choice of observation type (RGB Pixels vs. Internal State) significantly impacts the performance and stability of the algorithms. Using the internal state generally leads to more stable and efficient learning, likely because it provides a more direct and less noisy representation of the environment's state.