## Line Chart: CIFAR-10 Test Accuracy vs. Alpha (α)
### Overview
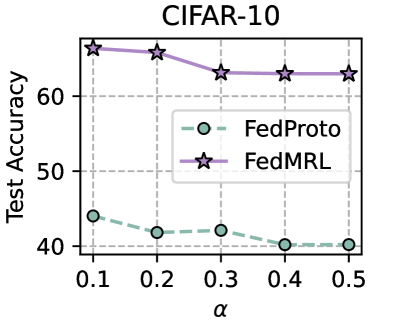
The image is a line chart comparing the test accuracy of two federated learning methods, FedProto and FedMRL, on the CIFAR-10 dataset as a function of a parameter labeled "α". The chart shows that FedMRL consistently achieves significantly higher accuracy than FedProto across the entire range of α values tested.
### Components/Axes
* **Chart Title:** "CIFAR-10" (centered at the top).
* **Y-Axis:**
* **Label:** "Test Accuracy" (rotated vertically on the left).
* **Scale:** Linear scale from 40 to 60, with major tick marks and grid lines at 40, 50, and 60.
* **X-Axis:**
* **Label:** "α" (centered at the bottom).
* **Scale:** Linear scale from 0.1 to 0.5, with major tick marks at 0.1, 0.2, 0.3, 0.4, and 0.5.
* **Legend:** Positioned in the center-right area of the plot.
* **FedProto:** Represented by a green, dashed line with circular markers (○).
* **FedMRL:** Represented by a purple, solid line with star-shaped markers (☆).
### Detailed Analysis
**Data Series 1: FedMRL (Purple, Solid Line, Star Markers)**
* **Trend:** The line shows a slight, gradual decline as α increases, but remains relatively stable and high.
* **Data Points (Approximate):**
* α = 0.1: ~65.5%
* α = 0.2: ~65.0%
* α = 0.3: ~63.0%
* α = 0.4: ~63.0%
* α = 0.5: ~63.0%
**Data Series 2: FedProto (Green, Dashed Line, Circle Markers)**
* **Trend:** The line shows a general downward trend as α increases, with a minor fluctuation.
* **Data Points (Approximate):**
* α = 0.1: ~44.0%
* α = 0.2: ~42.0%
* α = 0.3: ~42.5%
* α = 0.4: ~40.0%
* α = 0.5: ~40.0%
### Key Observations
1. **Performance Gap:** There is a substantial and consistent performance gap between the two methods. FedMRL's accuracy is approximately 20-23 percentage points higher than FedProto's at every measured α value.
2. **Stability:** FedMRL demonstrates greater stability. Its accuracy decreases by only about 2.5 percentage points across the α range. FedProto's accuracy decreases by approximately 4 percentage points.
3. **Parameter Sensitivity:** Both methods show some sensitivity to the α parameter, with performance generally decreasing as α increases from 0.1 to 0.5. The decline is more pronounced for FedProto.
4. **Plateau:** Both methods appear to plateau after α = 0.3 or 0.4, showing little to no change in accuracy between α = 0.4 and α = 0.5.
### Interpretation
This chart presents a comparative analysis of two algorithms (FedProto and FedMRL) in a federated learning context, likely evaluating their robustness or performance under varying conditions controlled by the parameter α (which could represent a heterogeneity factor, a weighting term, or a communication round parameter).
The data strongly suggests that **FedMRL is the superior method** for the CIFAR-10 task under the tested conditions. It not only achieves a much higher baseline accuracy but also maintains its performance more robustly as the α parameter changes. The consistent gap indicates a fundamental advantage in FedMRL's approach, possibly in how it handles model aggregation, feature representation, or non-IID data distributions common in federated settings.
The downward trend for both lines implies that increasing α (whatever it concretely represents) introduces a challenge that degrades model performance. The fact that FedMRL's decline is shallower suggests it is more resilient to this challenge. The plateau at higher α values could indicate a saturation point where further increases in the parameter no longer impact the models' convergence or final accuracy.