## Line Chart: ReLU-784-256-10 (softmax) Accuracy and Confidence
### Overview
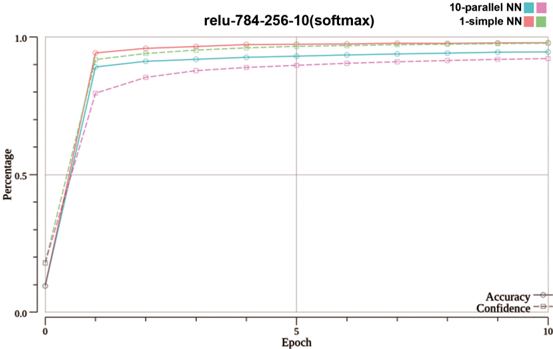
The image is a line chart comparing the accuracy and confidence of two neural network architectures: a "10-parallel NN" and a "1-simple NN". The chart plots the percentage (accuracy/confidence) on the y-axis against the epoch number on the x-axis.
### Components/Axes
* **Title:** relu-784-256-10(softmax)
* **X-axis:**
* Label: Epoch
* Scale: 0 to 10, with tick marks at 0, 5, and 10.
* **Y-axis:**
* Label: Percentage
* Scale: 0.0 to 1.0, with tick marks at 0.0, 0.5, and 1.0.
* **Legend (Top-Right):**
* 10-parallel NN (Teal)
* 1-simple NN (Salmon)
* Accuracy (Teal, circle marker)
* Confidence (Salmon, square marker)
### Detailed Analysis
* **10-parallel NN (Teal Line):** The accuracy of the 10-parallel NN increases sharply from epoch 0 to approximately epoch 2, reaching a percentage of approximately 0.95. After epoch 2, the accuracy continues to increase, but at a much slower rate, reaching approximately 0.97 by epoch 10.
* Epoch 0: ~0.1
* Epoch 2: ~0.95
* Epoch 10: ~0.97
* **1-simple NN (Salmon Line):** The accuracy of the 1-simple NN also increases sharply from epoch 0 to approximately epoch 2, reaching a percentage of approximately 0.95. After epoch 2, the accuracy continues to increase, but at a much slower rate, reaching approximately 0.98 by epoch 10.
* Epoch 0: ~0.1
* Epoch 2: ~0.95
* Epoch 10: ~0.98
* **Confidence of 10-parallel NN (Dashed Pink Line with Square Markers):** The confidence of the 10-parallel NN increases sharply from epoch 0 to approximately epoch 2, reaching a percentage of approximately 0.85. After epoch 2, the confidence continues to increase, but at a much slower rate, reaching approximately 0.92 by epoch 10.
* Epoch 0: ~0.1
* Epoch 2: ~0.85
* Epoch 10: ~0.92
* **Confidence of 1-simple NN (Dashed Gray Line with Square Markers):** The confidence of the 1-simple NN increases sharply from epoch 0 to approximately epoch 2, reaching a percentage of approximately 0.85. After epoch 2, the confidence continues to increase, but at a much slower rate, reaching approximately 0.92 by epoch 10.
* Epoch 0: ~0.1
* Epoch 2: ~0.85
* Epoch 10: ~0.92
### Key Observations
* Both neural network architectures show a rapid increase in accuracy and confidence during the first few epochs.
* The accuracy of the 1-simple NN is slightly higher than the accuracy of the 10-parallel NN after epoch 2.
* The confidence of both networks is lower than their accuracy.
* The confidence of both networks appears to converge to the same value.
### Interpretation
The chart suggests that both the 10-parallel NN and the 1-simple NN architectures are effective in this task, with the 1-simple NN performing slightly better in terms of accuracy after the initial epochs. The lower confidence scores compared to accuracy scores may indicate that the models are sometimes making correct predictions without being entirely certain. The convergence of confidence scores suggests that both models may be reaching a similar level of certainty as they continue to train. The rapid increase in accuracy and confidence in the initial epochs highlights the importance of early training stages.