## Heatmaps: Hypothesized, Write, and Read Weightings
### Overview
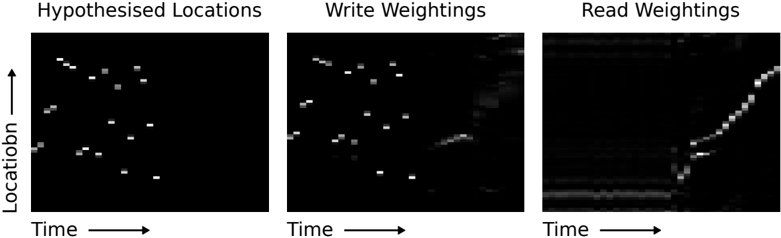
The image presents three heatmaps side-by-side, visualizing "Hypothesized Locations," "Write Weightings," and "Read Weightings." Each heatmap displays data points as varying shades of gray against a black background, with axes representing "Locationbn" (vertical) and "Time" (horizontal). The intensity of the gray indicates the magnitude or weighting at each location and time point.
### Components/Axes
* **Titles:**
* Left: "Hypothesised Locations"
* Center: "Write Weightings"
* Right: "Read Weightings"
* **Axes:**
* Vertical (all three heatmaps): "Locationbn" with an arrow pointing upwards.
* Horizontal (all three heatmaps): "Time" with an arrow pointing to the right.
* **Color Scale:** The heatmaps use a grayscale color scheme, where darker shades represent lower values and lighter shades represent higher values. The background is black.
### Detailed Analysis
**1. Hypothesised Locations**
* **Trend:** The heatmap shows scattered, discrete points of activity. These points appear as small, light-gray or white rectangles against the black background.
* **Data Points:**
* There are approximately 15-20 distinct points visible.
* The points are distributed across the "Locationbn" axis, with some clustering in the middle and lower regions.
* The points appear at various "Time" intervals, suggesting activity at different time steps.
* The intensity of the points varies, indicating different levels of "weighting" or "activity" at each location and time.
**2. Write Weightings**
* **Trend:** Similar to "Hypothesised Locations," this heatmap also shows discrete points of activity, but with some blurring or smearing, indicating a spread of weighting.
* **Data Points:**
* The number of distinct points is similar to "Hypothesised Locations," around 15-20.
* The points are less sharply defined, with a gradual fade from light gray to black.
* There is a concentration of activity in the lower-right portion of the heatmap.
* The intensity of the points varies, with some points appearing brighter than others.
**3. Read Weightings**
* **Trend:** This heatmap shows a more structured pattern compared to the other two. There is a distinct diagonal band of activity, suggesting a sequential reading process.
* **Data Points:**
* A prominent diagonal line of light-gray/white points extends from the top-right to the bottom-left.
* There are also some horizontal lines of activity, particularly in the lower half of the heatmap.
* The intensity of the diagonal line varies, with some points appearing brighter than others.
* The lower portion of the heatmap shows a more continuous, less discrete pattern of activity.
### Key Observations
* The "Hypothesised Locations" heatmap shows sparse, discrete activity, representing potential locations of interest.
* The "Write Weightings" heatmap shows a similar pattern, but with some blurring, suggesting the assignment of weights to these locations.
* The "Read Weightings" heatmap shows a more structured pattern, with a diagonal line indicating a sequential reading process and horizontal lines indicating activity at specific locations.
### Interpretation
The three heatmaps likely represent different stages in a memory or attention mechanism. "Hypothesised Locations" could represent potential locations to attend to. "Write Weightings" could represent the assignment of importance or relevance to these locations. "Read Weightings" could represent the process of retrieving information from these locations, with the diagonal line indicating a sequential reading process. The horizontal lines in "Read Weightings" might indicate specific locations that are being actively read. The blurring in "Write Weightings" suggests a distribution of attention or weighting around the hypothesized locations. The data suggests a system that first identifies potential locations, assigns weights to them, and then reads from them in a structured manner.