## Chart: Hypervector Dimension vs. F1 Score for Different Datasets
### Overview
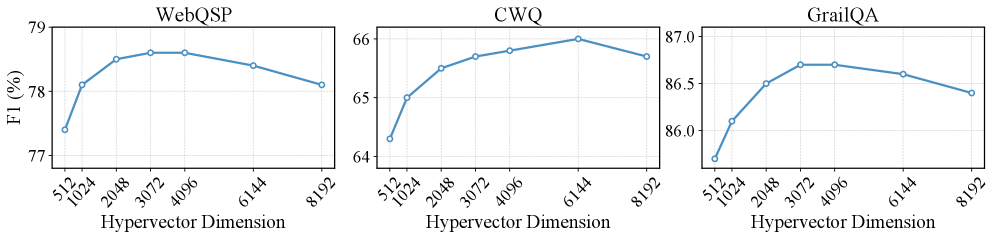
This image presents three line charts, each displaying the relationship between Hypervector Dimension and F1 Score (%) for three different datasets: WebQSP, CWQ, and GrailQA. Each chart shows how the F1 score changes as the hypervector dimension increases.
### Components/Axes
* **X-axis (all charts):** Hypervector Dimension, with markers at 3/512, 1024, 2048, 3072, 4096, 6144, and 8192.
* **Y-axis (all charts):** F1 Score (%), ranging from approximately 76.5% to 87.0%.
* **Chart 1 (left):** WebQSP dataset.
* **Chart 2 (center):** CWQ dataset.
* **Chart 3 (right):** GrailQA dataset.
* **Line Color (all charts):** Blue.
### Detailed Analysis
**Chart 1: WebQSP**
The line representing WebQSP slopes upward from a value of approximately 76.5% at a hypervector dimension of 3/512 to a peak of approximately 78.8% at 4096. It then declines slightly to approximately 77.8% at 8192.
* 3/512: ~76.5%
* 1024: ~77.8%
* 2048: ~78.4%
* 3072: ~78.7%
* 4096: ~78.8%
* 6144: ~78.2%
* 8192: ~77.8%
**Chart 2: CWQ**
The line representing CWQ starts at approximately 64.2% at a hypervector dimension of 3/512, increases to a peak of approximately 66.3% at 6144, and then decreases to approximately 65.8% at 8192.
* 3/512: ~64.2%
* 1024: ~65.0%
* 2048: ~65.5%
* 3072: ~65.9%
* 4096: ~66.1%
* 6144: ~66.3%
* 8192: ~65.8%
**Chart 3: GrailQA**
The line representing GrailQA begins at approximately 85.8% at a hypervector dimension of 3/512, rises to a peak of approximately 86.7% at 4096, and then declines to approximately 86.3% at 8192.
* 3/512: ~85.8%
* 1024: ~86.1%
* 2048: ~86.3%
* 3072: ~86.5%
* 4096: ~86.7%
* 6144: ~86.5%
* 8192: ~86.3%
### Key Observations
* All three datasets show an initial increase in F1 score as the hypervector dimension increases.
* The F1 scores generally plateau or slightly decrease after reaching a certain hypervector dimension.
* GrailQA consistently exhibits the highest F1 scores across all hypervector dimensions.
* CWQ consistently exhibits the lowest F1 scores across all hypervector dimensions.
* The peak F1 score for each dataset occurs at different hypervector dimensions (WebQSP: 4096, CWQ: 6144, GrailQA: 4096).
### Interpretation
The charts demonstrate the impact of hypervector dimension on the performance (measured by F1 score) of models trained on different datasets. The initial increase in F1 score suggests that increasing the hypervector dimension allows the model to capture more complex relationships within the data. However, the plateau or decline in F1 score at higher dimensions indicates that there is a point of diminishing returns, and potentially overfitting, where adding more dimensions does not further improve performance.
The differences in peak F1 scores and optimal hypervector dimensions across the datasets suggest that the optimal model configuration is dataset-dependent. GrailQA, with its consistently high F1 scores, may be a simpler or more structured dataset compared to WebQSP and CWQ. The fact that the optimal dimension varies suggests that the complexity of the relationships within each dataset differs. The diminishing returns observed in all three charts suggest that there is a trade-off between model complexity (hypervector dimension) and generalization performance.