\n
## Box Plots: Causal Effect Analysis under Different Fairness Constraints
### Overview
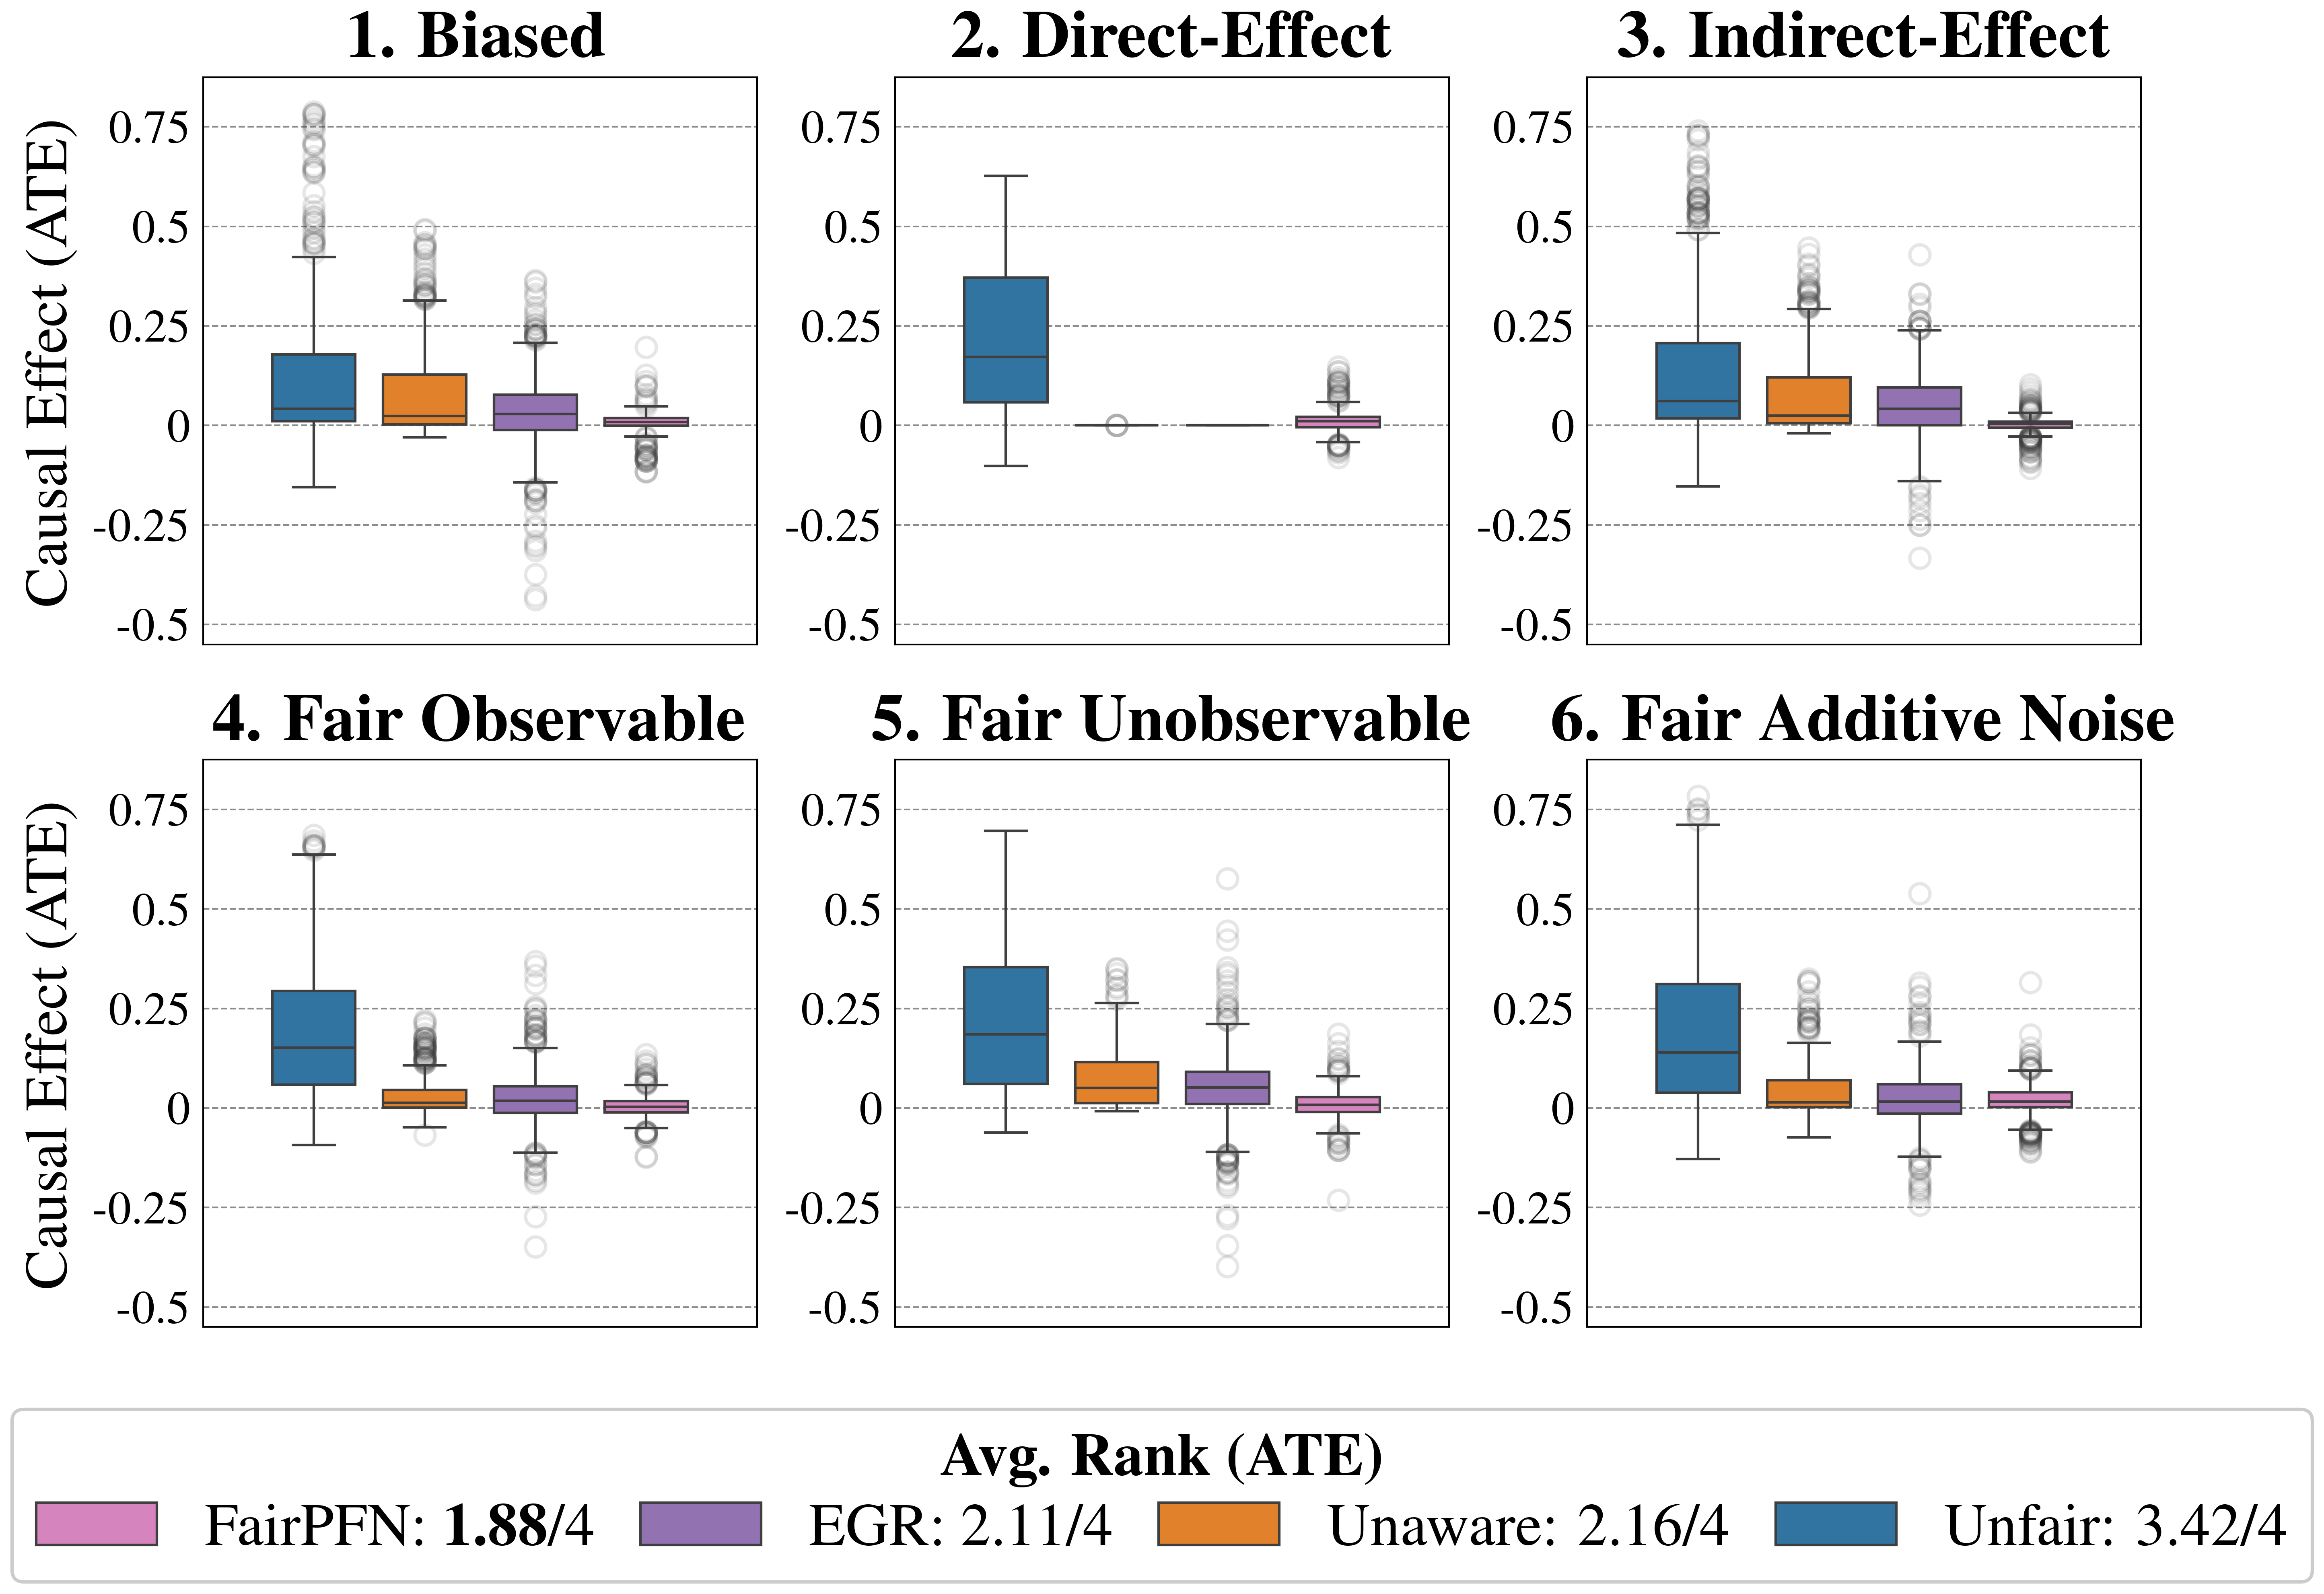
The image presents six box plots, each representing the distribution of causal effects (ATE - Average Treatment Effect) under different fairness scenarios. Each plot compares four different algorithms: FairPFN, EGR, Unaware, and Unfair. The x-axis represents the average rank of each algorithm, and the y-axis represents the causal effect. A horizontal gray dashed line at y=0 serves as a reference point.
### Components/Axes
* **Y-axis:** "Causal Effect (ATE)" ranging from -0.5 to 0.75.
* **X-axis:** "Avg. Rank (ATE)" with values 1, 2, 3, and 4.
* **Titles:** Each subplot is titled with a fairness scenario: "1. Biased", "2. Direct-Effect", "3. Indirect-Effect", "4. Fair Observable", "5. Fair Unobservable", "6. Fair Additive Noise".
* **Legend:** Located at the bottom center of the image.
* FairPFN: Purple, labeled "1.88/4"
* EGR: Green, labeled "2.11/4"
* Unaware: Orange, labeled "2.16/4"
* Unfair: Blue, labeled "3.42/4"
### Detailed Analysis
Each subplot displays box plots for the four algorithms. The box plots show the median, quartiles, and outliers of the causal effect distribution.
**1. Biased:**
* FairPFN (Purple): Median around 0.1, IQR from approximately 0 to 0.25. Several outliers above 0.5.
* EGR (Green): Median around 0.2, IQR from approximately 0 to 0.3.
* Unaware (Orange): Median around 0, IQR from approximately -0.1 to 0.15.
* Unfair (Blue): Median around 0.25, IQR from approximately 0.1 to 0.4.
**2. Direct-Effect:**
* FairPFN (Purple): Median around 0.25, IQR from approximately 0.1 to 0.4.
* EGR (Green): Median around 0.25, IQR from approximately 0.1 to 0.4.
* Unaware (Orange): Median around 0, IQR from approximately -0.1 to 0.1.
* Unfair (Blue): Median around 0.25, IQR from approximately 0.1 to 0.4.
**3. Indirect-Effect:**
* FairPFN (Purple): Median around 0.2, IQR from approximately 0 to 0.3.
* EGR (Green): Median around 0.2, IQR from approximately 0 to 0.3.
* Unaware (Orange): Median around 0, IQR from approximately -0.1 to 0.1.
* Unfair (Blue): Median around 0.2, IQR from approximately 0 to 0.3.
**4. Fair Observable:**
* FairPFN (Purple): Median around 0.25, IQR from approximately 0.1 to 0.4.
* EGR (Green): Median around 0.2, IQR from approximately 0 to 0.3.
* Unaware (Orange): Median around 0, IQR from approximately -0.1 to 0.1.
* Unfair (Blue): Median around 0.2, IQR from approximately 0 to 0.3.
**5. Fair Unobservable:**
* FairPFN (Purple): Median around 0.2, IQR from approximately 0 to 0.3.
* EGR (Green): Median around 0.2, IQR from approximately 0 to 0.3.
* Unaware (Orange): Median around 0, IQR from approximately -0.1 to 0.1.
* Unfair (Blue): Median around 0.2, IQR from approximately 0 to 0.3.
**6. Fair Additive Noise:**
* FairPFN (Purple): Median around 0.2, IQR from approximately 0 to 0.3.
* EGR (Green): Median around 0.2, IQR from approximately 0 to 0.3.
* Unaware (Orange): Median around 0, IQR from approximately -0.1 to 0.1.
* Unfair (Blue): Median around 0.2, IQR from approximately 0 to 0.3.
### Key Observations
* The "Unfair" algorithm consistently exhibits a higher median causal effect than the other algorithms across most scenarios.
* The "Unaware" algorithm generally has a median causal effect close to zero.
* FairPFN and EGR show similar distributions in most scenarios.
* The average rank values in the legend indicate that FairPFN performs best (lowest rank) on average, followed by EGR and Unaware, with Unfair performing worst.
* Outliers are present in several box plots, particularly for FairPFN, suggesting variability in the causal effect.
### Interpretation
The data suggests that the "Unfair" algorithm consistently produces a higher causal effect, potentially indicating a bias in its predictions. The "Unaware" algorithm, which does not consider fairness constraints, tends to have a neutral causal effect. FairPFN and EGR, designed with fairness in mind, achieve comparable performance and generally exhibit lower causal effects than the "Unfair" algorithm. The average rank values confirm that FairPFN is the best-performing algorithm overall, followed by EGR. The presence of outliers suggests that the causal effect can vary significantly depending on the specific data instance. The different fairness scenarios (Biased, Direct-Effect, etc.) highlight the importance of considering different types of fairness constraints when evaluating and comparing algorithms. The consistent performance of FairPFN and EGR across these scenarios suggests their robustness to different fairness challenges.