## Heatmaps: AttnScore vs. Laplacian Eigenvalues
### Overview
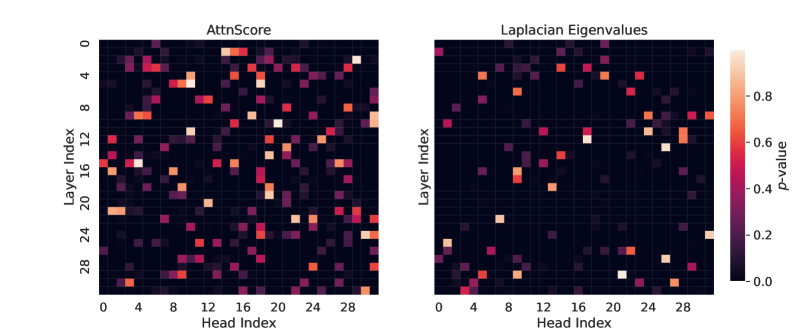
The image presents two heatmaps side-by-side, visualizing "AttnScore" and "Laplacian Eigenvalues." Both heatmaps share the same axes: "Layer Index" (vertical) and "Head Index" (horizontal), ranging from 0 to 28. The color intensity in each heatmap represents a "p-value," as indicated by the colorbar on the right, ranging from 0.0 (dark purple) to 0.8 (light orange).
### Components/Axes
* **Titles:**
* Left Heatmap: "AttnScore"
* Right Heatmap: "Laplacian Eigenvalues"
* **Axes:**
* Vertical Axis (both heatmaps): "Layer Index," with ticks at 0, 4, 8, 12, 16, 20, 24, and 28.
* Horizontal Axis (both heatmaps): "Head Index," with ticks at 0, 4, 8, 12, 16, 20, 24, and 28.
* **Colorbar (right side):**
* Label: "p-value"
* Scale: Ranges from 0.0 (dark purple) to 0.8 (light orange), with ticks at 0.0, 0.2, 0.4, 0.6, and 0.8.
### Detailed Analysis
**AttnScore Heatmap (Left):**
* The heatmap displays the p-values for AttnScore across different layers and heads.
* There is a distribution of p-values across the layers and heads.
* Layer 20, Head 4 has a p-value of approximately 0.6.
* Layer 12, Head 12 has a p-value of approximately 0.4.
* Layer 4, Head 4 has a p-value of approximately 0.8.
**Laplacian Eigenvalues Heatmap (Right):**
* The heatmap displays the p-values for Laplacian Eigenvalues across different layers and heads.
* The distribution of p-values appears less dense compared to the AttnScore heatmap.
* Layer 0, Head 4 has a p-value of approximately 0.6.
* Layer 28, Head 20 has a p-value of approximately 0.4.
* Layer 4, Head 28 has a p-value of approximately 0.8.
### Key Observations
* Both heatmaps show the distribution of p-values across different layers and heads.
* The AttnScore heatmap appears to have a higher density of non-zero p-values compared to the Laplacian Eigenvalues heatmap.
* The p-values range from 0.0 to 0.8 in both heatmaps.
### Interpretation
The heatmaps visualize the statistical significance (p-value) of AttnScore and Laplacian Eigenvalues across different layers and heads of a model (likely a neural network). The AttnScore heatmap suggests that attention scores are more consistently significant across various layers and heads, while the Laplacian Eigenvalues heatmap indicates that the significance of Laplacian Eigenvalues is more sparse or concentrated in specific layer-head combinations. This could imply that attention mechanisms play a more pervasive role in the model's operation compared to the properties captured by Laplacian Eigenvalues.