\n
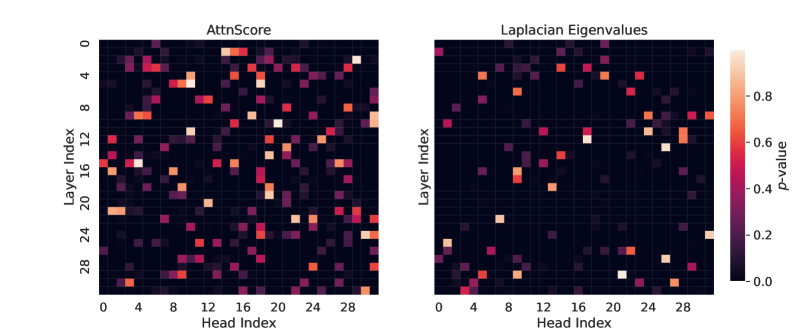
## Heatmaps: Attention Scores and Laplacian Eigenvalues
### Overview
The image presents two heatmaps displayed side-by-side. The left heatmap is titled "AttnScore" and the right is titled "Laplacian Eigenvalues". Both heatmaps share the same axes: "Head Index" on the x-axis and "Layer Index" on the y-axis. Both heatmaps use a color scale ranging from dark purple (approximately 0.0) to bright yellow (approximately 1.0), representing "p-value". The heatmaps visualize the relationship between layer and head indices, with color intensity indicating the corresponding p-value.
### Components/Axes
* **X-axis:** "Head Index", ranging from 0 to 28, with markers at integer values.
* **Y-axis:** "Layer Index", ranging from 0 to 28, with markers at integer values.
* **Color Scale:** A continuous scale from dark purple (0.0) to bright yellow (1.0), representing "p-value". The scale is positioned on the right side of the image.
* **Left Heatmap Title:** "AttnScore"
* **Right Heatmap Title:** "Laplacian Eigenvalues"
### Detailed Analysis or Content Details
**AttnScore Heatmap (Left)**
The AttnScore heatmap shows a sparse distribution of high p-values (bright yellow/orange). The heatmap appears to have several localized areas of higher intensity.
* Around Layer Index 0, there are several bright spots between Head Index 16 and 24.
* Around Layer Index 4, there are bright spots between Head Index 0 and 8.
* Around Layer Index 8, there are bright spots between Head Index 0 and 8.
* Around Layer Index 12, there are bright spots between Head Index 0 and 8.
* Around Layer Index 16, there are bright spots between Head Index 0 and 8.
* Around Layer Index 24, there are bright spots between Head Index 0 and 8.
* Around Layer Index 28, there are bright spots between Head Index 0 and 8.
The majority of the heatmap is dark purple, indicating low p-values (close to 0.0).
**Laplacian Eigenvalues Heatmap (Right)**
The Laplacian Eigenvalues heatmap also shows a sparse distribution of high p-values. The pattern is different from the AttnScore heatmap.
* Around Layer Index 0, there are bright spots between Head Index 20 and 24.
* Around Layer Index 4, there are bright spots between Head Index 16 and 20.
* Around Layer Index 8, there are bright spots between Head Index 16 and 20.
* Around Layer Index 12, there are bright spots between Head Index 16 and 20.
* Around Layer Index 16, there are bright spots between Head Index 16 and 20.
* Around Layer Index 24, there are bright spots between Head Index 16 and 20.
* Around Layer Index 28, there are bright spots between Head Index 16 and 20.
Similar to the AttnScore heatmap, most of the area is dark purple, indicating low p-values.
### Key Observations
* Both heatmaps exhibit sparse distributions of high p-values.
* The locations of high p-values differ between the two heatmaps, suggesting different relationships between layer and head indices for attention scores and Laplacian eigenvalues.
* The heatmaps suggest that certain combinations of layer and head indices are more significant (higher p-values) than others.
* The majority of the combinations have low p-values, indicating a generally weak relationship.
### Interpretation
The two heatmaps likely represent the results of an analysis of a neural network model, possibly a transformer. "AttnScore" likely represents the attention scores between different heads and layers, while "Laplacian Eigenvalues" might represent a spectral analysis of the network's connectivity. The p-values indicate the statistical significance of the relationships between the layer and head indices.
The differing patterns in the two heatmaps suggest that the attention mechanism and the network's spectral properties are governed by different underlying structures. The sparse distribution of high p-values suggests that the network is not fully connected or that only specific connections are crucial for its performance. The localized areas of high p-values could indicate important interactions between specific layers and heads.
Further investigation would be needed to understand the specific meaning of these patterns in the context of the model's task and architecture. The heatmaps provide a visual overview of the relationships between layers and heads, which can be used to guide further analysis and potentially improve the model's performance.