## Heatmap Comparison: AttnScore vs. Laplacian Eigenvalues
### Overview
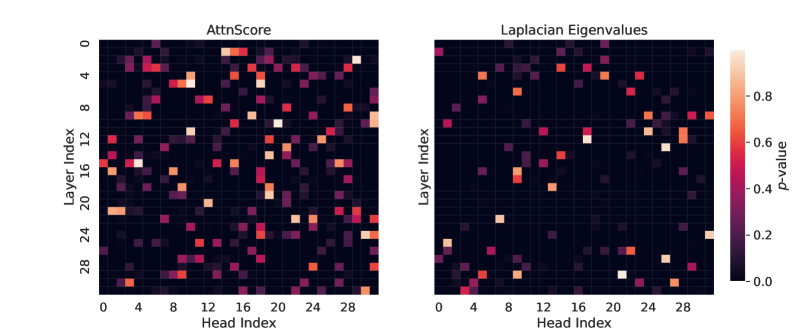
The image displays two side-by-side heatmaps visualizing statistical significance (p-values) across different layers and heads of a neural network model. The left heatmap is titled "AttnScore" and the right "Laplacian Eigenvalues." Both plots share identical axes and a common color scale, allowing for direct comparison of the spatial distribution of significant values between the two metrics.
### Components/Axes
* **Chart Type:** Two 2D heatmaps (grid plots).
* **Titles:**
* Left Chart: "AttnScore"
* Right Chart: "Laplacian Eigenvalues"
* **Y-Axis (Both Charts):** Labeled "Layer Index." The scale runs from 0 at the top to approximately 30 at the bottom, with major tick marks at intervals of 4 (0, 4, 8, 12, 16, 20, 24, 28).
* **X-Axis (Both Charts):** Labeled "Head Index." The scale runs from 0 on the left to approximately 30 on the right, with major tick marks at intervals of 4 (0, 4, 8, 12, 16, 20, 24, 28).
* **Color Bar (Right Side):** A vertical legend labeled "p-value." It maps color to numerical value, ranging from dark purple/black at the bottom (0.0) through magenta and orange to a light peach/white at the top (approximately 0.9-1.0). Major tick marks are at 0.0, 0.2, 0.4, 0.6, and 0.8.
* **Grid Structure:** Each heatmap is a grid of cells, where each cell's color corresponds to the p-value for a specific (Layer Index, Head Index) pair.
### Detailed Analysis
**Left Heatmap: AttnScore**
* **Trend/Pattern:** The distribution of high p-values (bright orange/white cells) is not uniform. There is a notable concentration of significant values (p-value > ~0.6) in two regions:
1. **Top-Left Corner:** A cluster of bright cells spanning approximately Layer Index 0-6 and Head Index 0-8.
2. **Bottom-Right Corner:** A cluster of bright cells spanning approximately Layer Index 20-30 and Head Index 20-30.
* **Specific High-Value Points (Approximate):**
* Layer 0, Head 0: Very bright (p-value ~0.9).
* Layer 2, Head 4: Bright orange (p-value ~0.7-0.8).
* Layer 20, Head 28: Very bright (p-value ~0.9).
* Layer 24, Head 24: Bright orange (p-value ~0.7).
* Layer 28, Head 0: Bright orange (p-value ~0.7).
* The central region (Layers ~8-18, Heads ~8-18) is predominantly dark, indicating low p-values (p-value < ~0.2).
**Right Heatmap: Laplacian Eigenvalues**
* **Trend/Pattern:** High p-values are more sparsely and randomly distributed compared to the AttnScore map. There is no strong clustering in the corners. Significant values appear as isolated bright cells scattered across the grid.
* **Specific High-Value Points (Approximate):**
* Layer 0, Head 0: Bright (p-value ~0.7).
* Layer 4, Head 12: Bright orange (p-value ~0.7).
* Layer 12, Head 20: Bright (p-value ~0.7).
* Layer 16, Head 24: Bright (p-value ~0.7).
* Layer 28, Head 28: Very bright (p-value ~0.9).
* The overall density of bright cells appears lower than in the AttnScore map.
### Key Observations
1. **Spatial Correlation:** The AttnScore metric shows a strong spatial correlation, with significance concentrated in the early layers/early heads and late layers/late heads. This suggests a structured pattern in attention score significance.
2. **Spatial Randomness:** The Laplacian Eigenvalues metric shows a more random, uncorrelated distribution of significance across the layer-head space.
3. **Common High-Value Point:** Both metrics show a very high p-value at the coordinate (Layer 28, Head 28), indicating strong significance for this specific head in the final layers for both measures.
4. **Contrast in Central Region:** The central band of the network (middle layers and heads) shows consistently low significance for AttnScore but contains several isolated significant points for Laplacian Eigenvalues.
### Interpretation
This visualization compares the statistical significance of two different analytical metrics—Attention Scores and Laplacian Eigenvalues—applied to the internal components (attention heads across layers) of a neural network, likely a transformer model.
* **What the Data Suggests:** The stark contrast in patterns implies that these two metrics capture fundamentally different aspects of the model's internal workings. The structured, corner-heavy pattern of AttnScore significance might indicate that the most statistically noteworthy attention behaviors occur in the initial processing stages (early layers) and the final integration stages (late layers). In contrast, the scattered significance of Laplacian Eigenvalues suggests this metric identifies important heads in a more layer-agnostic, function-specific manner.
* **Relationship Between Elements:** The shared axes and color scale are critical for this comparative analysis. The side-by-side layout allows the viewer to immediately discern the difference in spatial distribution. The common high-significance point at (28,28) is a key finding, highlighting a head that is important according to both criteria.
* **Notable Anomalies/Insights:** The most striking insight is the lack of correlation between the two patterns. If the metrics were measuring similar phenomena, one would expect their heatmaps to resemble each other. Their dissimilarity suggests they are probes for different types of information flow or structural properties within the model. This could be valuable for model interpretability, indicating that different analysis techniques are needed to understand different facets of model behavior. The concentration of AttnScore significance in the corners could be related to how information is initially embedded and finally aggregated in transformer architectures.