\n
## Line Chart: Per-Period Regret vs. Time Period
### Overview
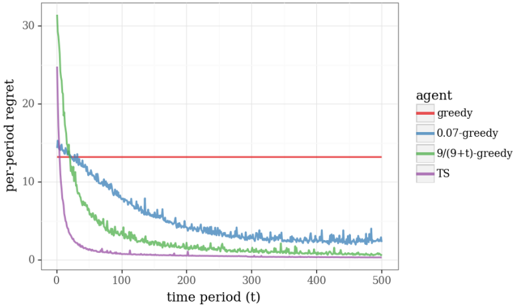
This image presents a line chart illustrating the per-period regret of different agents over time. The x-axis represents the time period (t), ranging from 0 to 500. The y-axis represents the per-period regret, ranging from 0 to 30. Four different agent strategies are compared: greedy, 0.07-greedy, 9/(9+t)-greedy, and TS (Thompson Sampling).
### Components/Axes
* **X-axis:** "time period (t)" - Scale ranges from approximately 0 to 500.
* **Y-axis:** "per-period regret" - Scale ranges from approximately 0 to 30.
* **Legend (top-right):**
* "greedy" - Red line
* "0.07-greedy" - Gray line
* "9/(9+t)-greedy" - Green line
* "TS" - Purple line
### Detailed Analysis
* **Greedy (Red):** The line is nearly flat and horizontal, maintaining a constant per-period regret of approximately 14.5 throughout the entire time period.
* **0.07-greedy (Gray):** This line starts at approximately 24 regret at t=0 and slopes downward, exhibiting significant fluctuations. It reaches a minimum regret of approximately 5 at t=200, then fluctuates between 5 and 10 for the remainder of the time period, ending at approximately 7 at t=500.
* **9/(9+t)-greedy (Green):** This line begins at approximately 24 regret at t=0 and demonstrates a steep downward slope initially. It continues to decrease, but at a slower rate, reaching a regret of approximately 2 at t=200. It continues to decline, approaching a regret of approximately 0.5 at t=500.
* **TS (Purple):** This line starts at approximately 24 regret at t=0 and rapidly decreases, reaching a regret of approximately 1 at t=50. It continues to decline, approaching a regret of approximately 0 at t=200 and remaining very close to 0 for the rest of the time period, ending at approximately 0.1 at t=500.
### Key Observations
* The "greedy" agent exhibits the highest and constant per-period regret throughout the entire time period.
* The "TS" agent consistently demonstrates the lowest per-period regret, rapidly converging to near-zero regret.
* The "9/(9+t)-greedy" agent shows a significant reduction in regret over time, but not as quickly as the "TS" agent.
* The "0.07-greedy" agent shows a fluctuating regret, with a slower initial decline and a plateau around a regret of 7-10.
### Interpretation
The chart demonstrates the performance of different agent strategies in a dynamic environment, likely a reinforcement learning scenario. The per-period regret metric quantifies the sub-optimality of each agent's decisions over time.
The "greedy" agent's constant high regret suggests it consistently makes suboptimal choices, failing to adapt to the changing environment. The "TS" agent's rapid convergence to near-zero regret indicates its effectiveness in exploring and exploiting the environment to minimize regret. The "9/(9+t)-greedy" agent's decreasing regret suggests a learning process, where the agent gradually improves its decision-making over time. The "0.07-greedy" agent's fluctuating regret suggests a balance between exploration and exploitation, but with less consistent performance than the "TS" agent.
The differences in performance highlight the importance of exploration-exploitation strategies in reinforcement learning. The "TS" agent, with its ability to balance exploration and exploitation, appears to be the most effective strategy in this scenario. The "9/(9+t)-greedy" agent's performance suggests that a decaying exploration rate can lead to improved performance over time. The "0.07-greedy" agent's performance suggests that the exploration rate of 0.07 may not be optimal for this environment.